Simulate a process, find the constraint and prove the effect, in seven steps
What FlowVisual is, what it was built for and how to use it: what to gather beforehand, what to click in which order, how to read the result, and what makes numbers collapse the moment someone in the steering committee asks.
FlowVisual is a desktop process simulator for macOS and Windows. You model a workflow by hand, enter volumes, capacities and handling times as ranges, and run it through hundreds of Monte Carlo passes. The result tells you which step caps throughput and with what probability, how long a case takes at the median and at P90, and what a change would be worth in euros and time. The first full pass takes about 30 minutes. No event log, no account, no cloud.
What FlowVisual is built for and what it is not
A tool pointed at the wrong question gives a clean answer to nothing. So the boundaries first.
- Finding the constraint under variability, meaning the step that caps throughput, not the one people complain about loudest.
- Costing a process that does not exist yet: planned automation, a new split of roles, twice the volume.
- Showing the second-order effect: where the constraint moves once you fix it. That is the point where most business cases fall apart.
- Proving a measure in euros and time, with a P10–P90 range instead of a number carrying two decimals.
- Modelling live in a workshop while the people who do the work sit next to you and object.
- Not process mining. FlowVisual does not measure the past from system logs, it computes an assumption, which is why it needs no event log.
- Not a BPMN tool. Six building blocks instead of a notation. If you need standards-compliant process documentation, you will not get it here.
- Not an architecture repository. One process per model, not the whole organisation at once.
- Not a tool for prettier pictures. It does not draw better, it calculates.
Rule of thumb: if you have an event log and want to know what happened yesterday, a mining tool is right. If you want to know what happens tomorrow once step 3 is automated, it is not. This page describes how the program is operated; the approach behind it (eight steps, interviews, prioritisation, or someone to run it with you) is the method on flowrefy.com.
What to gather before you start
Twenty minutes of preparation save two hours of rework. Each step needs five inputs. Estimated is allowed, invented is not.
- 01
Volume at the entrance
How many cases arrive per day, and how many more on a heavy day? Both are in the ERP, the ticket system or the invoice inbox.
- 02
Handling time as a range
Not 7.5 minutes, but 5 to 15 minutes. The range is the actual information, it is what creates the queue you are here for.
- 03
Capacity per step
Either people × hours per day × efficiency, or a flat takt in cases per day when a machine or a fixed rhythm sets the limit.
- 04
Role and system per step
Who does it, in which system? That is where load per role and the media breaks in the IT view come from.
- 05
Fully loaded hourly rate
Gross salary × 1.5 to 1.8, divided by roughly 1,500 productive hours a year. A 50,000-euro position costs about 53 euros an hour, not the naive 24. With the naive rate every euro statement is attackable later.
If a number is missing: estimate it, record it as an open assumption, move on. A model with visible assumptions beats a spreadsheet with hidden ones.
The seven steps
Same order, every time. Follow it and half an hour later you have a number you can defend.
- 012 minutes
Install it and look at a finished model
On launch FlowVisual offers three ways in: the two-minute guided tour, the templates, or an empty model. Take a template the first time, whether order handling, quotation, invoice approval, complaint handling, employee onboarding or IT ticket. Thirty seconds show you what a finished model looks like instead of you deriving it.
To do- 1Choose Browse templates in the welcome window
- 2Open a template and let the guided tour run alongside
- 3Then use New process for your own model
Common mistakeStarting with your own process without ever having seen a finished one. You end up building it far too fine-grained.
- 0210 minutes
Draw the workflow
Six building blocks sit on the left: start, step, decision, end, drop-off, sub-process. Nothing else is needed. With Connect you click the source first, then the target. Five to ten steps are enough for a model that says something. Draw twenty and you are modelling the organisation instead of the constraint.
To do- 1Place the start, then the steps in the order the work really flows
- 2Decisions where a case genuinely branches, with a routing weight per edge
- 3Drop-off for everything that leaves the process: withdrawn, declined, stalled
Common mistakeModelling edge cases that account for two percent of the volume. They do not change the result and cost an hour.
FlowVisual 1.2.1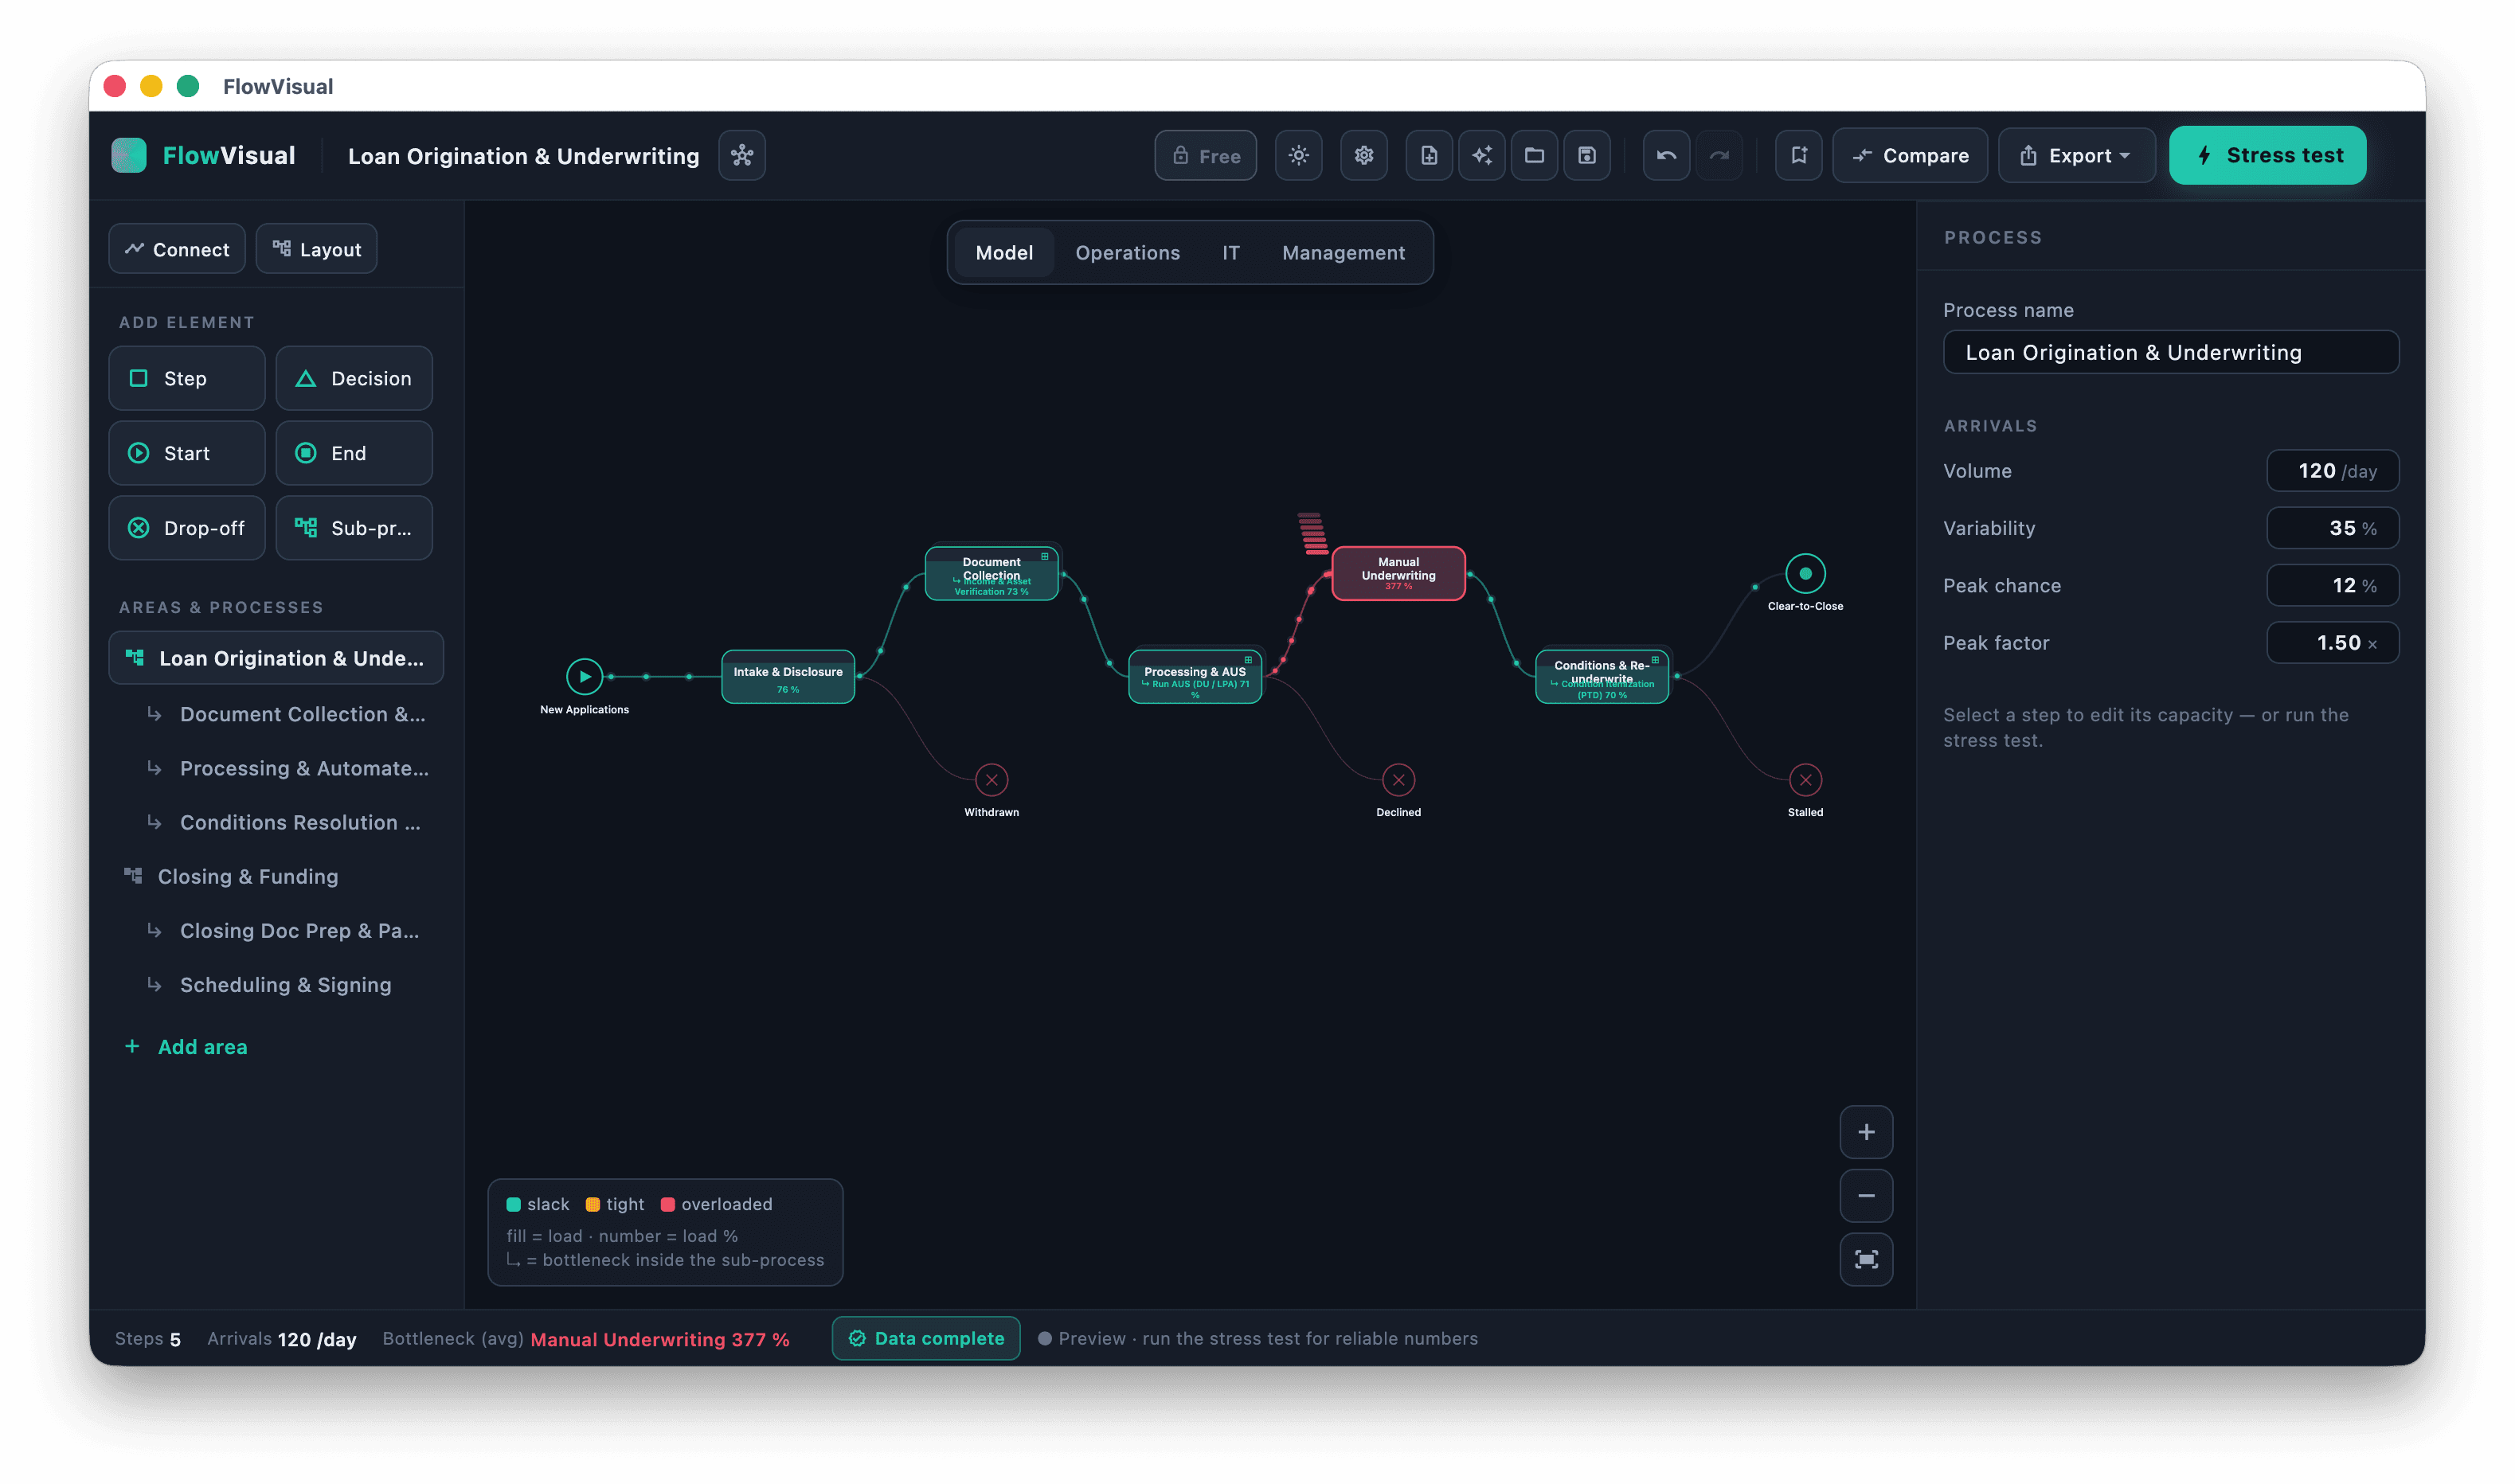
Model view: five steps, three drop-offs. The fill of a block is the work in it, the number is its load, the colour its state. Here one step at 377 percent holds up everything else. - 038 minutes
Enter volumes, times and costs
The inspector is on the right. With nothing selected it shows arrivals: volume per day, variability, peak chance, peak factor. Select a step and it becomes the step view: name, capacity, handling from–to, hourly rate. Everything finer (disruption chance, remaining capacity, roles, systems) sits below, not in front.
To do- 1Set arrivals: volume per day, variability, peak chance, peak factor
- 2Per step: capacity as people × hours per day or as takt, plus handling from–to
- 3Enter role, system and hourly rate, they carry the euro statement later
Common mistakeSetting handling from and to to the same value. Without a range no queue forms, and the stress test shows a world that does not exist.
- 042 minutes
Watch it run before you calculate
The model runs immediately. Work flows along the edges, queues build and drain, the colour of a block shows load: green has slack, amber is tight, red is over capacity. These two minutes are not decoration. This is where a missing connection or a reversed routing weight becomes obvious.
To do- 1Watch it and check with the people who do the work: does it really run like this?
- 2Check the status bar: number of steps, arrivals, any warning about incomplete data
- 3Move on only once the picture matches the real workflow
Common mistakeMistaking the running picture for the result. It is the preview, the defensible numbers come from the stress test.
- 051 minute
Run the stress test and read the constraint
Stress test, top right. FlowVisual runs hundreds of passes with sampled arrivals and handling times. The panel names where it hurts first: the constraint with its probability, meaning in how many passes this step was the limit. Below that, cycle time as median and P90, the share of days over capacity, throughput, and fragility.
To do- 1Click Stress test and leave the result on screen
- 2Click the top bar, it opens that step directly in the inspector
- 3Walk through all four views: model, operations, IT, management
Common mistakeLooking only at the average. The P90 cycle time is the one customers complain about.
FlowVisual 1.2.1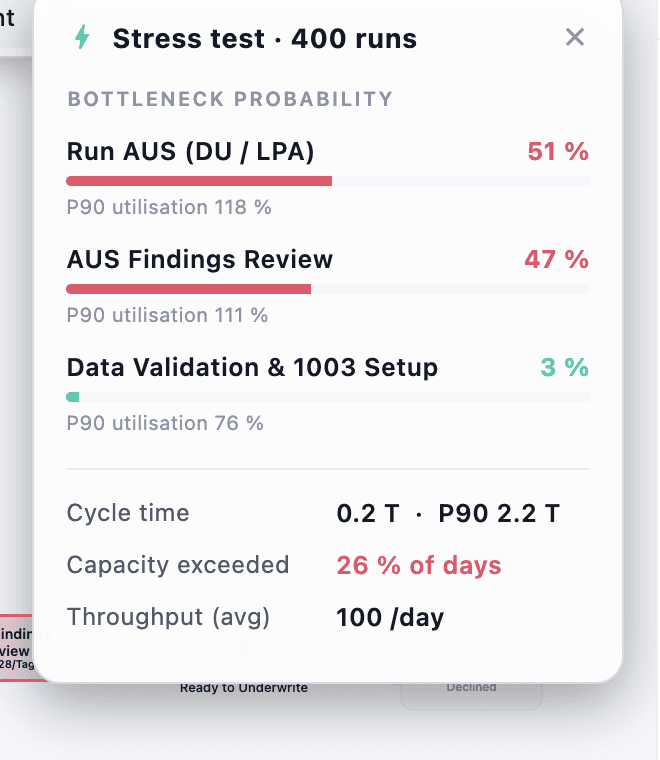
The stress panel after 400 passes: constraint probability per step, load on the peak day, cycle time as median and P90, share of days over capacity. - 065 minutes
Snapshot the baseline, pull one lever, measure again
This step turns an observation into an argument. Snapshot baseline freezes the before state. Then change exactly one thing: capacity up, handling time down, automate a step, swap a sub-process. Run the stress test again and open Compare for before and after in euros and time, with a range.
To do- 1Snapshot the baseline, without it there is nothing to compare against
- 2Change exactly one lever, not three
- 3Re-run the stress test and open Compare
Common mistakePulling two levers at once. Afterwards nobody knows which one worked, and in case of doubt, neither did.
- 073 minutes
Prove it and hand it over
Two documents leave the tool via Export: the branded proposal with before/after, reviewed options and a recommendation, and the documentation with the model, its assumptions, the number of passes and the limits of the analysis. Saving and exporting need a licence; modelling, stress testing and all four views stay free.
To do- 1Set letterhead, logo and accent colour in the settings first
- 2Export → Proposal (PDF) for the decision maker
- 3Export → Documentation (PDF) so the result stays reproducible
Common mistakeLeaving template values in the export. If the proposal still carries the sample hourly rates, the whole document is worthless.
The six numbers that matter
A stress test produces more numbers than fit into a conversation. These six carry the statement.
- Constraint probability
- In how many passes this step was the limit. If the top value is below 50 percent there is a second candidate, and then both belong in the conversation.
- Load on the peak day
- Demand divided by capacity on a heavy day, not as a monthly average. From about 85 percent the queue grows disproportionately; from 100 percent it grows without bound.
- Cycle time: median and P90
- Half of all cases are faster than the median. Ten percent sit above P90, and those are the cases customers complain about.
- Capacity exceeded
- The share of days on which a step receives more work than it can do. Those days create the backlog you see at month end.
- Throughput
- Finished cases per day. It is capped by the constraint, so improvements at any other step do not move it.
- Fragility
- How much extra volume it takes before the next step breaks. It answers the growth question before it is asked.
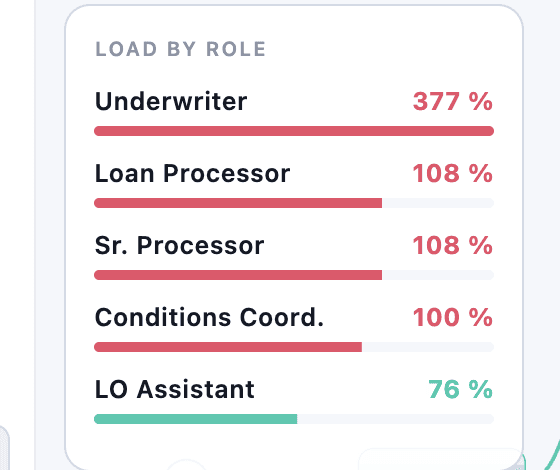
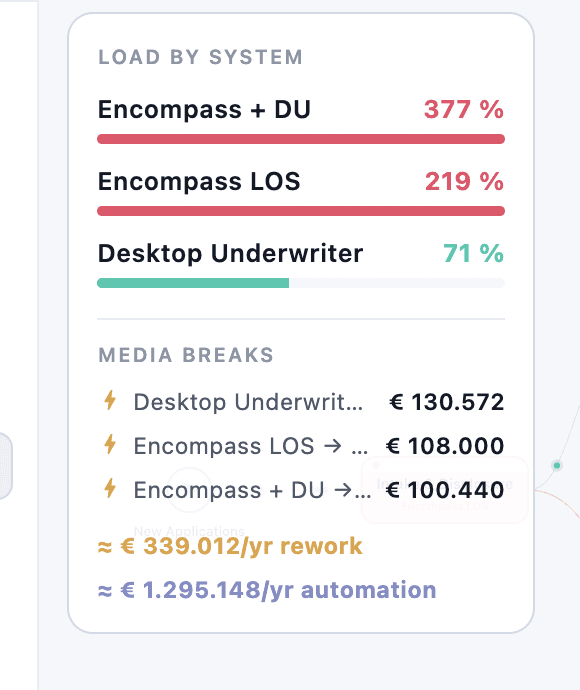
Every one of these numbers is a range, not a point value. Pass it on as a point value and you promise an accuracy the model does not have.
What the tool can do and what it deliberately cannot
- Discrete-event simulation with Monte Carlo repetition: hundreds of passes, ranges instead of an average.
- Six building blocks, sub-processes, areas and a landscape view, from a single workflow to a structured process landscape.
- Shared resources: several steps running on the same role, the same system, the same machine.
- Four views of one model: model, operations, IT, management, with no second document and nothing lost in translation.
- Options ranked with a recommendation, including the statement that one of them is not worth doing.
- Export as a branded proposal and as documentation, plus the model data as JSON.
- No event log import. FlowVisual reads no system logs. What is in the model, you entered.
- No standards-compliant BPMN documentation.
- No multi-user server. Collaboration runs through the file on a shared drive or in SharePoint.
- No prediction for an individual case. The answer is always a distribution, never a due date.
Why not just Excel, Visio or a mining tool
Each of these tools is right for something. The only question is which question you are trying to answer.
Excel
Right forFor the cost breakdown nobody needs to simulate.
What FlowVisual does differentlyA spreadsheet adds up averages. It knows neither queues nor peak days, and that is exactly where lead time comes from.
Visio, Lucidchart, Miro
Right forFor the picture on the wall and the alignment in a workshop.
What FlowVisual does differentlyA diagram shows the sequence, not the load. FlowVisual runs the same drawing and shows which box holds up the rest.
BPMN suites
Right forFor standards-compliant documentation and execution in a process engine.
What FlowVisual does differentlySix building blocks instead of a notation, but a real simulation engine underneath. If you need BPMN for documentation, keep it alongside.
Process mining
Right forWhen a clean event log exists and the question is: what happened?
What FlowVisual does differentlyNo log, no data project soaking up 60 to 90 percent of the effort. And FlowVisual can cost a process that does not exist yet.
Simulation labs such as Simul8, Arena, AnyLogic
Right forFor production lines, material flows and models someone works on for weeks.
What FlowVisual does differentlyFor administrative processes in hours instead of weeks, with roles, systems and euros instead of machine parameters.
The rule stands: if one of these tools answers your question better, use it. A comparison that talks the competition down is not a comparison.
Five mistakes that cost you the number in the meeting
- 01
Point value instead of a range
There is no such thing as 7.5 minutes. Without a range the model computes a world without queues, and lead time comes out too good.
- 02
Naive hourly rate
Gross salary divided by hours is not a fully loaded rate. The first controller who checks it topples the whole calculation.
- 03
Too fine a model
Twenty steps feel thorough and hide the constraint among the details. Five to ten steps are enough.
- 04
No baseline snapshot
Without a baseline there is no before and after, only two opinions.
- 05
Sample analysis in the indicative
As long as nothing has been measured, results belong in the conditional: would be, not is. Show results and you promise results.
To tick off
60-minute workshop
- 01Pick a process, one with a pain people can feel.
- 02Draw the current workflow: start, steps, decision, end. No more than needed.
- 03Per step: role, system, handling from–to, capacity.
- 04Set volume and variability at the entrance.
- 05Snapshot the current state as the baseline.
- 06Run the stress test and read the constraint together.
- 07Test one lever. Only one.
- 08Measure again and show the constraint moving.
- 09Discuss before and after, note the open assumptions.
Before exporting
- 01Model structurally sound: one entrance, every step reachable, one end.
- 02Rates and volumes are the client's, not the template's.
- 03The baseline matches the real current state.
- 04Results phrased as ranges, not as promises.
- 05For sample analyses: conditional wording and a note on their sample character.
- 06Letterhead, accent colour and proposal number set.
- 07Limits of the analysis present as their own section.
Get FlowVisual 1.2.1
Native app for macOS and Windows. Modelling and stress testing are free forever, and you don't need an account to start.
macOS 13 or newer (Apple Silicon and Intel) · Windows 10/11
Frequently asked about using it
How long does the first pass really take?
With the numbers prepared, about 30 minutes: ten minutes drawing, eight minutes entering numbers, one minute of stress test, the rest comparison and export. Without prepared numbers, gathering them comes on top. That is the real effort, not the tool.
Do I need an event log or access to systems?
No. The model is built by hand. That is exactly why it can also cost a process that does not exist yet, a planned automation for instance. A process mining tool structurally cannot do that.
Which steps of this guide are free?
Steps 1 to 6: modelling, stress testing, comparing and all four views, permanently and without an account. A licence is needed for saving and for the exports in step 7.
How precise do my estimates have to be?
For the question of where it hurts, estimated ranges are enough: the constraint is remarkably stable against imprecise inputs. For the euro statement in a proposal, volumes, capacities and hourly rates should be measured.
Can I compare several scenarios?
Yes. Snapshot the baseline, change something, stress test again, open Compare. FlowVisual puts before and after side by side in euros and time, as a range, not a single value.
Does this work in a workshop with the business side?
That is what it was built for. The model runs while you build it, so an objection from the room can be entered and seen immediately. The checklist above is the short form of a 60-minute workshop.
Rather do it together? We'll model your most expensive process with you.
In 20 minutes we capture your most important process and show you the bottleneck in euros, live in FlowVisual.
No sales pitch. No slides. Straight talk.