Press kit · version 1.2.1

Press

Everything an article about FlowVisual needs: edited boilerplate in three lengths, the facts behind it, images at full size, quotes cleared for use — and the section most press kits leave out: what the tool cannot do. Free to use, no permission needed.

Version1.2.1
PlatformmacOS · Windows
Languages9
Pricefrom €0
Updated8 September 2026
01Boilerplate

Three lengths, ready to paste

Each text is edited and may be used as it stands — as a news item, a sidebar, a paragraph in your own copy. No sign-off, no embargo.

One sentence · 25 words

FlowVisual is a desktop process simulator for macOS and Windows: it runs a business process, names the constraint, and prices a planned change in money and time.

Short · 60 words

FlowVisual is a process simulator for macOS and Windows. Instead of drawing a flowchart, it runs the process: work flows through the model, load lands on the roles and systems that carry it, and a Monte Carlo stress test over thousands of working days names the constraint. Every planned change is re-simulated end to end and reported as Before/After in money and time — as a range, never as one flattering figure. It all runs locally, with no account and no cloud.

Long · 150 words

FlowVisual is a process simulator for the desks of consultants, lean leads and operations managers — macOS and Windows, built by Balane GmbH in Munich. A diagram shows the order of the steps; it cannot tell you which role runs out of hours first, what the third handover costs over a year, or whether a recommendation still holds in a bad week. FlowVisual answers that, because it runs the process: durations go in as ranges (“8 to 20 minutes”), a Monte Carlo stress test takes the model through thousands of days and reports cycle time as P50 and P90, throughput, and the odds of breaching the promise. For every change it re-simulates the whole model rather than adding up savings — which is how you see that improving the wrong step buys nothing and only moves the constraint along. What leaves the building is a proposal PDF on your own letterhead, with an assumptions register and a P10–P90 band. Modelling and simulating are free for good.

About Balane GmbH

Balane GmbH is a software company in Munich. It builds tools for process work — FlowVisual for the simulation, flowrefy.com for the method behind it. Managing director is Jonas David Höttler. The products are sold direct, with no investors behind them.

How to write it

“FlowVisual” — one word, capital F, capital V, no space, not all caps. The company is “Balane GmbH”, not “Balane” alone where it matters legally. The method next door is called “FLOW” and belongs to flowrefy.com — it is not the product.

02The story

A diagram is a claim. A running process is a measurement.

The short version, for someone deciding in two minutes whether there is a story here.

01

The problem every consultant knows

The process gets captured, drawn, a measure is recommended. Then the board asks: what is it worth? To this day the answer is a slide with a round number on it, and the first hard question in the room takes it apart. Between drawing tools at €15 a month and simulation software at five figures a year sits exactly the gap where most process work actually happens.

02

What FlowVisual does differently

It computes. Work flows through the model as cases, queues build and drain, load lands on the roles, teams and systems that carry it. A Monte Carlo stress test takes the process through thousands of working days and says where it jams — on an average day and on a busy day, the tenth working day with a rush. Red means exactly one thing anywhere in the application: more work than capacity.

03

The sentence the whole product hangs on

Nobody should ever have to guess where a change takes effect. So FlowVisual never adds savings together; it re-simulates the entire model for each variant, sub-processes included. That is the difference between a spreadsheet where two measures are summed and a tool that shows you: the second measure buys nothing, because the first already moved the constraint. Improving the wrong step buys roughly zero throughput — that is not an opinion, it is the result of the second run.

04

Where it breaks next

Beside today's constraint sits a fragility curve: at what volume does the process tip, and which step takes over as the constraint then? The options grid proposes variants on its own — relieve the constraint, automate the priciest step, close a media break, bundle the best two — re-simulates each one in full and ranks them by effect. Before and After stand side by side, and every figure moves while you type.

05

Every figure states what it rests on

While inputs are estimates, the result is marked “provisional”, with the figure that ought to be measured first named beside it. In the proposal every number carries its basis — client statement, estimate or measurement — and behind it a register of every assumption the calculation stands on. Plus a plausibility check that contradicts the cover page when a measure saves money but lengthens cycle time or lowers throughput. A tool that argues with its own number is worth more in front of a CFO than one that only agrees.

06

What leaves the building

A proposal PDF on your own letterhead: the constraint, the measure, the value in hours and money — as a P10–P90 band, with a register of every assumption behind it, and a plausibility check that contradicts the cover page when a measure saves money but lengthens cycle time. Plus process documentation, Word, draw.io, SVG, JSON and CSV.

03How it computes

What happens between the input and the figure

The section for the question every good article asks: where does the number come from? All of this is in the shipped source as described — checkable against the application itself.

The loop — six steps, in this order

  1. 01Capture

    Steps, decisions, drop-offs, sub-processes. Per step: who does it, which system, how long — as a range, not a figure.

  2. 02Stress test

    400 runs. Each run is a working day with its own case volume and its own service times.

  3. 03Constraint

    The step that binds — with load on an average day and on a busy day, and beside it the curve showing at what volume it tips.

  4. 04Options

    Proposed variants, each re-simulated in full and ranked by effect. Nothing is added up.

  5. 05Prove

    The basis of every figure, a register of all assumptions, a plausibility check against your own recommendation.

  6. 06Export

    Proposal, process documentation, raw data — on your own letterhead.

A step counts as done only when a real artefact exists: a model with steps, a run with a result, a constraint that this run actually named. A bar that fills up as you click would be the fake progress meter this product refuses everywhere else.

What the engine does

Arrivals

The day's volume is drawn, not set: a lognormal around the stated figure, steered by variability, peak chance and peak factor. The same variability also enters the queue term as arrival variance.

Service

“8 to 20 minutes” is read as the P10–P90 of a lognormal. That way the occasional monster case beyond the upper bound can occur — a uniform draw between 8 and 20 could never produce it, and it is the one that ruins the day.

Queueing

Waiting follows Kingman (G/G/1): the factor (arrival plus service variance)/2 times utilisation/(1−utilisation). Near the capacity line the term is linearised and above it driven into saturation — beyond that line a queue has no steady state left to compute.

Routing

How often a step is visited per case is solved as a fixed point rather than by a topological sort. That is the only way rework counts: a “send it back for correction” loop disappears in a sort, and half the step's load with it. Cycles are found by Tarjan's algorithm; parallel branches that re-converge count the case once, not twice.

Shared resources and sub-processes

Several steps can compute against one team, one system or one licence pool. When the pool is short, the individual step is only the symptom — the finding names the pool. Sub-processes roll their capacity and service time up into the parent step, which is why an edit three levels down moves the headline figure.

What comes out

Cycle time as P50 and P90, throughput, the share of days over capacity, cost per day as a P10–P90 band — plus the average of the worst five percent of days, and flow efficiency: hands-on work divided by lead time. In real processes that tends to sit in the single digits, and it is the most uncomfortable number in the whole analysis.

Fragility

The same run again at 0.8 · 0.9 · 1.0 · 1.1 · 1.2 · 1.35 · 1.5 times today's volume. What is measured is not the level but the curvature: harm grows faster than load, which is how a step that is green today can be the first to go non-linear in a busy week.

Gaps stay gaps

A step nobody stated a capacity for cannot win the constraint ranking — and is not painted as slack either. If not one step states anything, the result reads “constraint undetermined” rather than an invented figure.

The thresholds live in the source, not in a brochure: 85 % utilisation is the knee past which waiting inflates sharply; from ten percent of days over capacity the verdict reads “strained”. And the randomness has a fixed seed — the same model gives the same figure when you open it again. A proposal whose result changes when you recompute it would be no proposal at all.

04Facts

The data sheet

Everything that fits in a fact box. Figures that change are pulled from the same source as the rest of the site, so they are current here.

Product
FlowVisual 1.2.1
Publisher
Balane GmbH, Balanstraße 84, 81541 Munich, Germany — HRB 301320, Munich Local Court
Category
Desktop business process simulation
Platforms
macOS 13 or newer (Apple Silicon and Intel), Windows 10/11 64-bit
Where to get it
Mac App Store, Microsoft Store, and signed installers straight from the release repository
Price
Modelling, the stress test, all four lenses, Before/After, presentation mode and the PDFs are free for good. Pro adds your own letterhead, the Word and draw.io exports, and the shared project folder.
Languages
Nine: English, German, French, Spanish, Italian, Portuguese, Japanese, Korean, Chinese (simplified). Currency switches separately.
Engine
Discrete-event simulation with Monte Carlo repetition. Results as P50 and P90, deltas as a P10–P90 band.
Lenses
Four readings of one model: Model, Operations, IT and Management — not four documents to keep in sync.
Import
Reads draw.io drawings and turns them into a model you can run — free, because nobody starts a project by redrawing forty boxes.
Export
PDF (proposal, documentation, change memo), Word, draw.io, SVG, JSON, CSV.
Privacy
No account, no cloud, no telemetry. The application makes exactly one network request: the licence check when a key is activated.
Technology
Flutter/Dart, one codebase for macOS and Windows. Files are plain text and live in the engagement folder or in version control.
Released
Version 1.2.1 on 8 September 2026

Prices in euro, consumer prices including VAT, billed annually. One licence key covers Windows and macOS at the same time.
05Images & mark

Images at full size

Every shot comes out of the real application window, rendered at 3520 × 2000 pixels — no mockup, no rebuilt interface. What you see is a demo process; there is no client data in it.

Download everything as ZIPContains both language versions of the images, the mark, the icon, and the boilerplate as a text file.
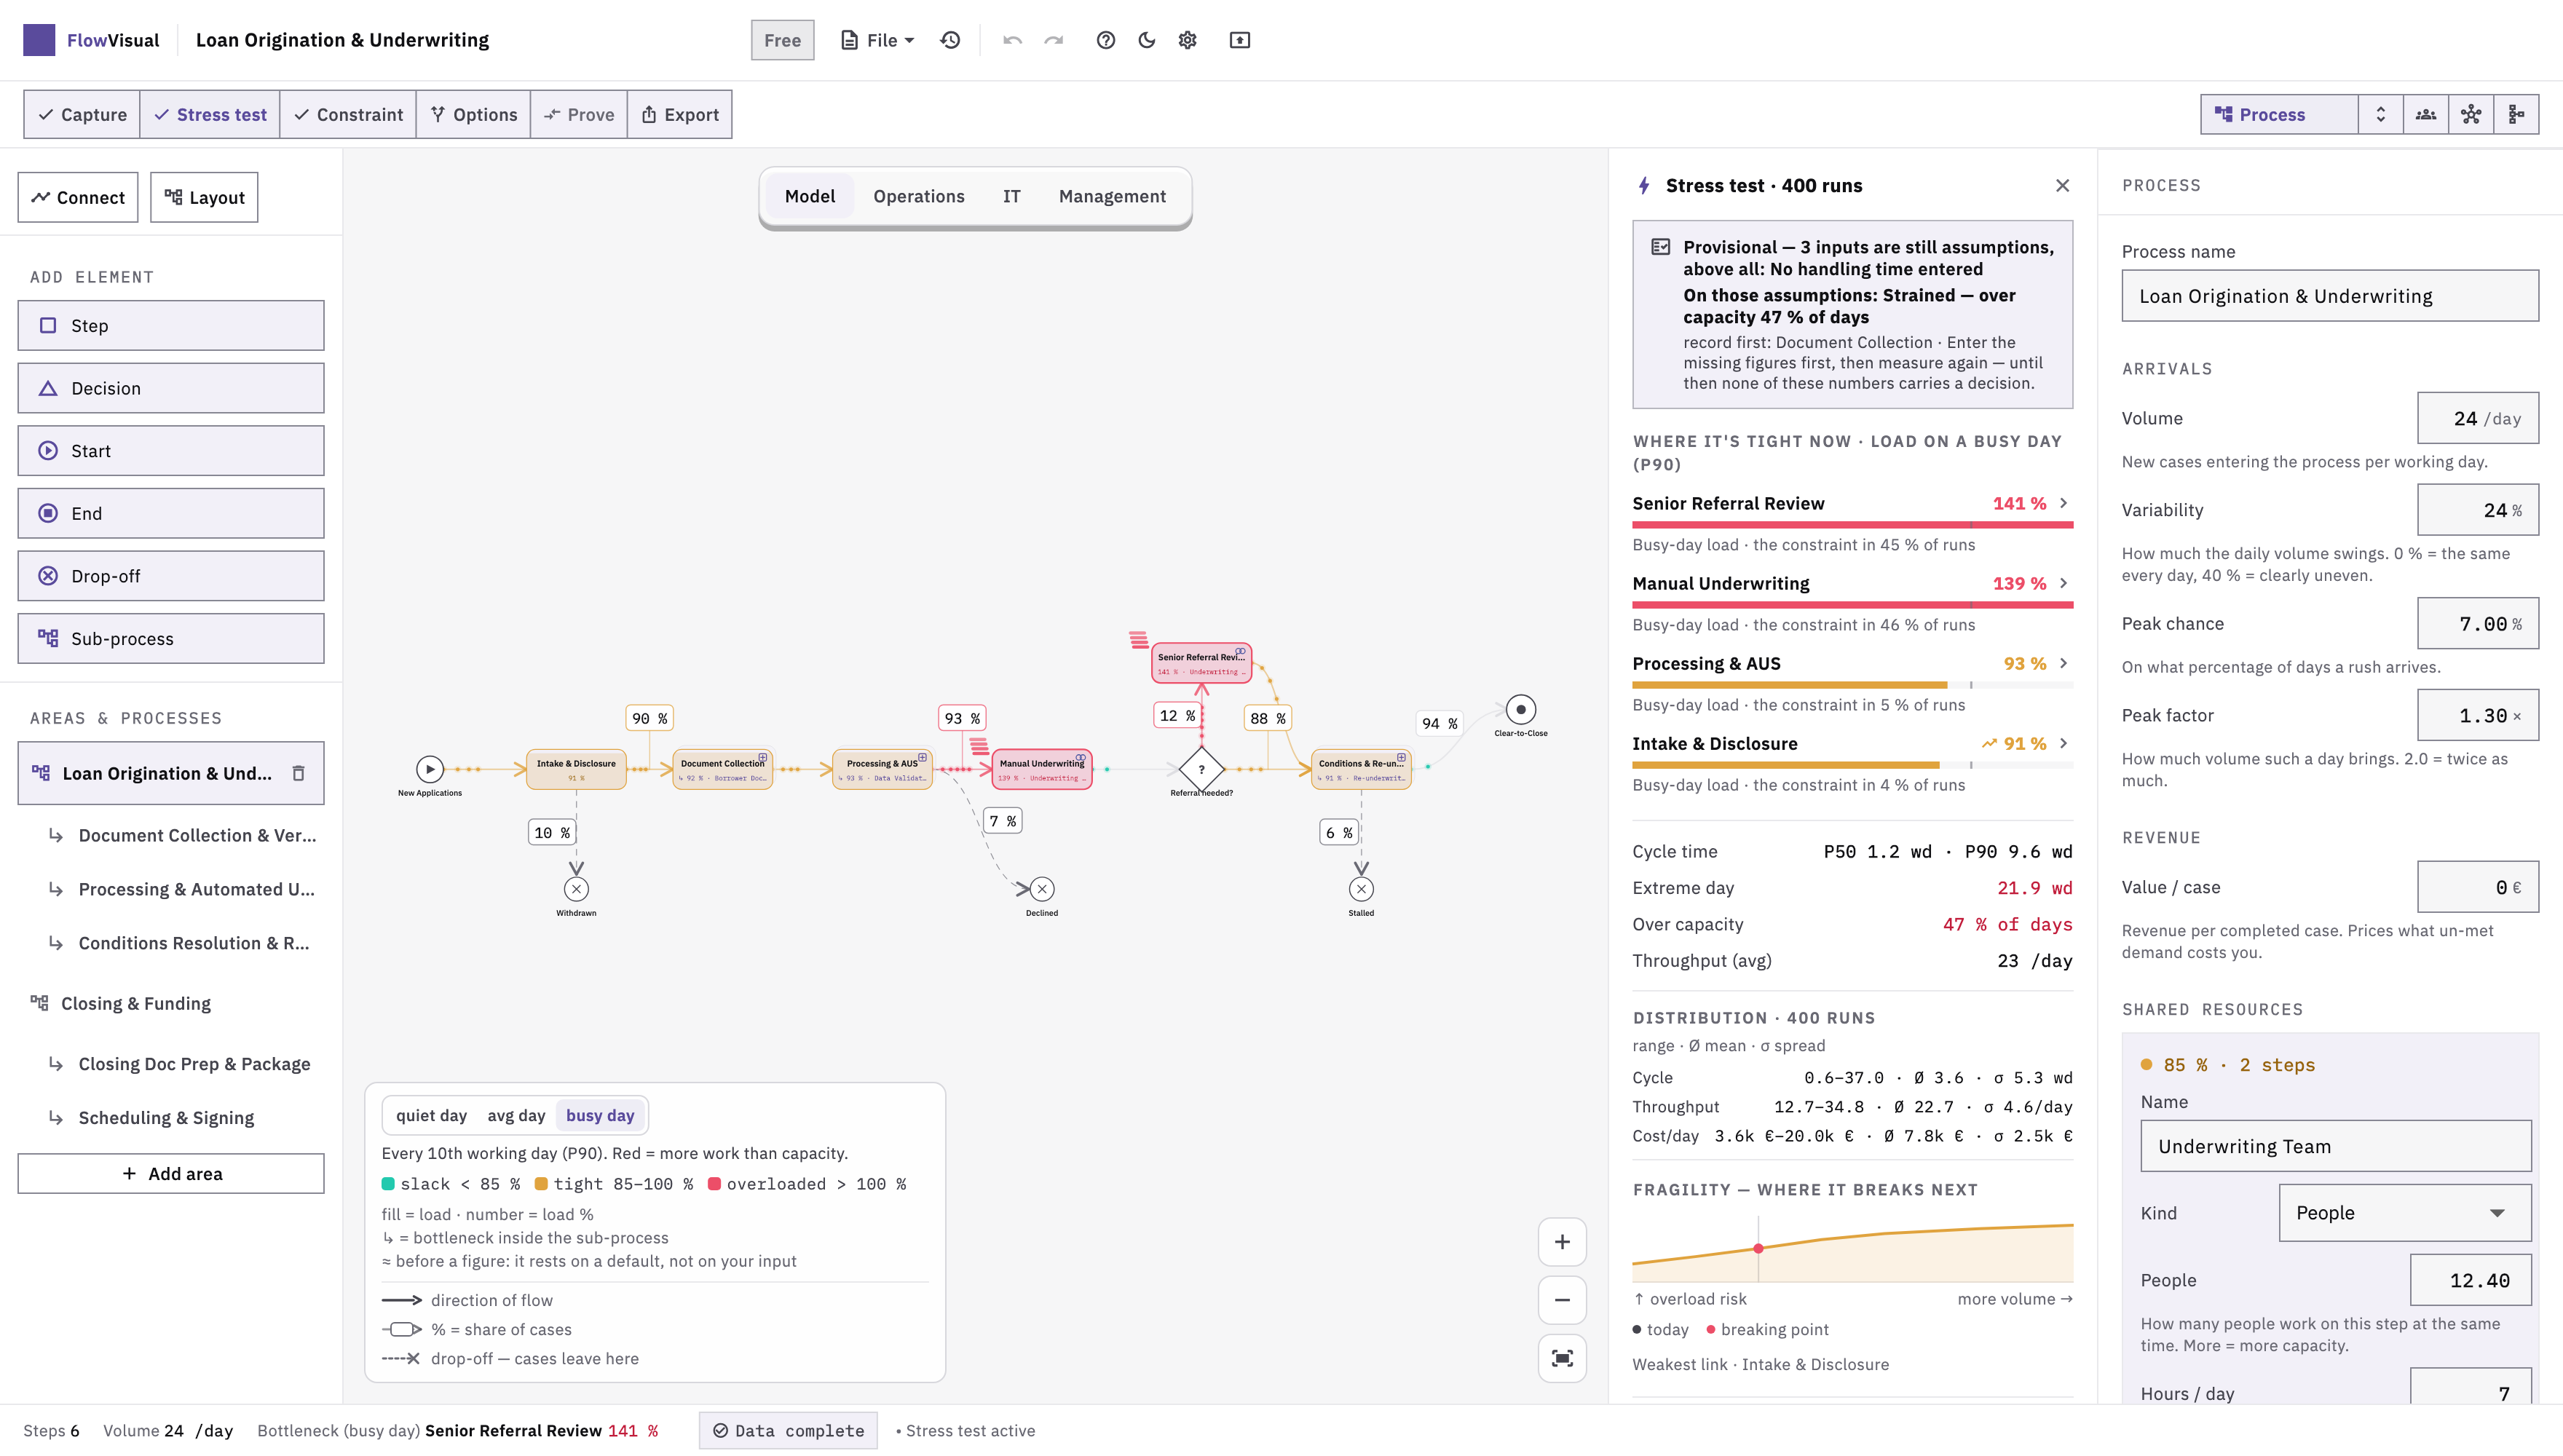
400 runs through the model: where it jams, cycle time as P50 and P90, the share of days over capacity — and the notice at the top that three inputs are still assumptions.
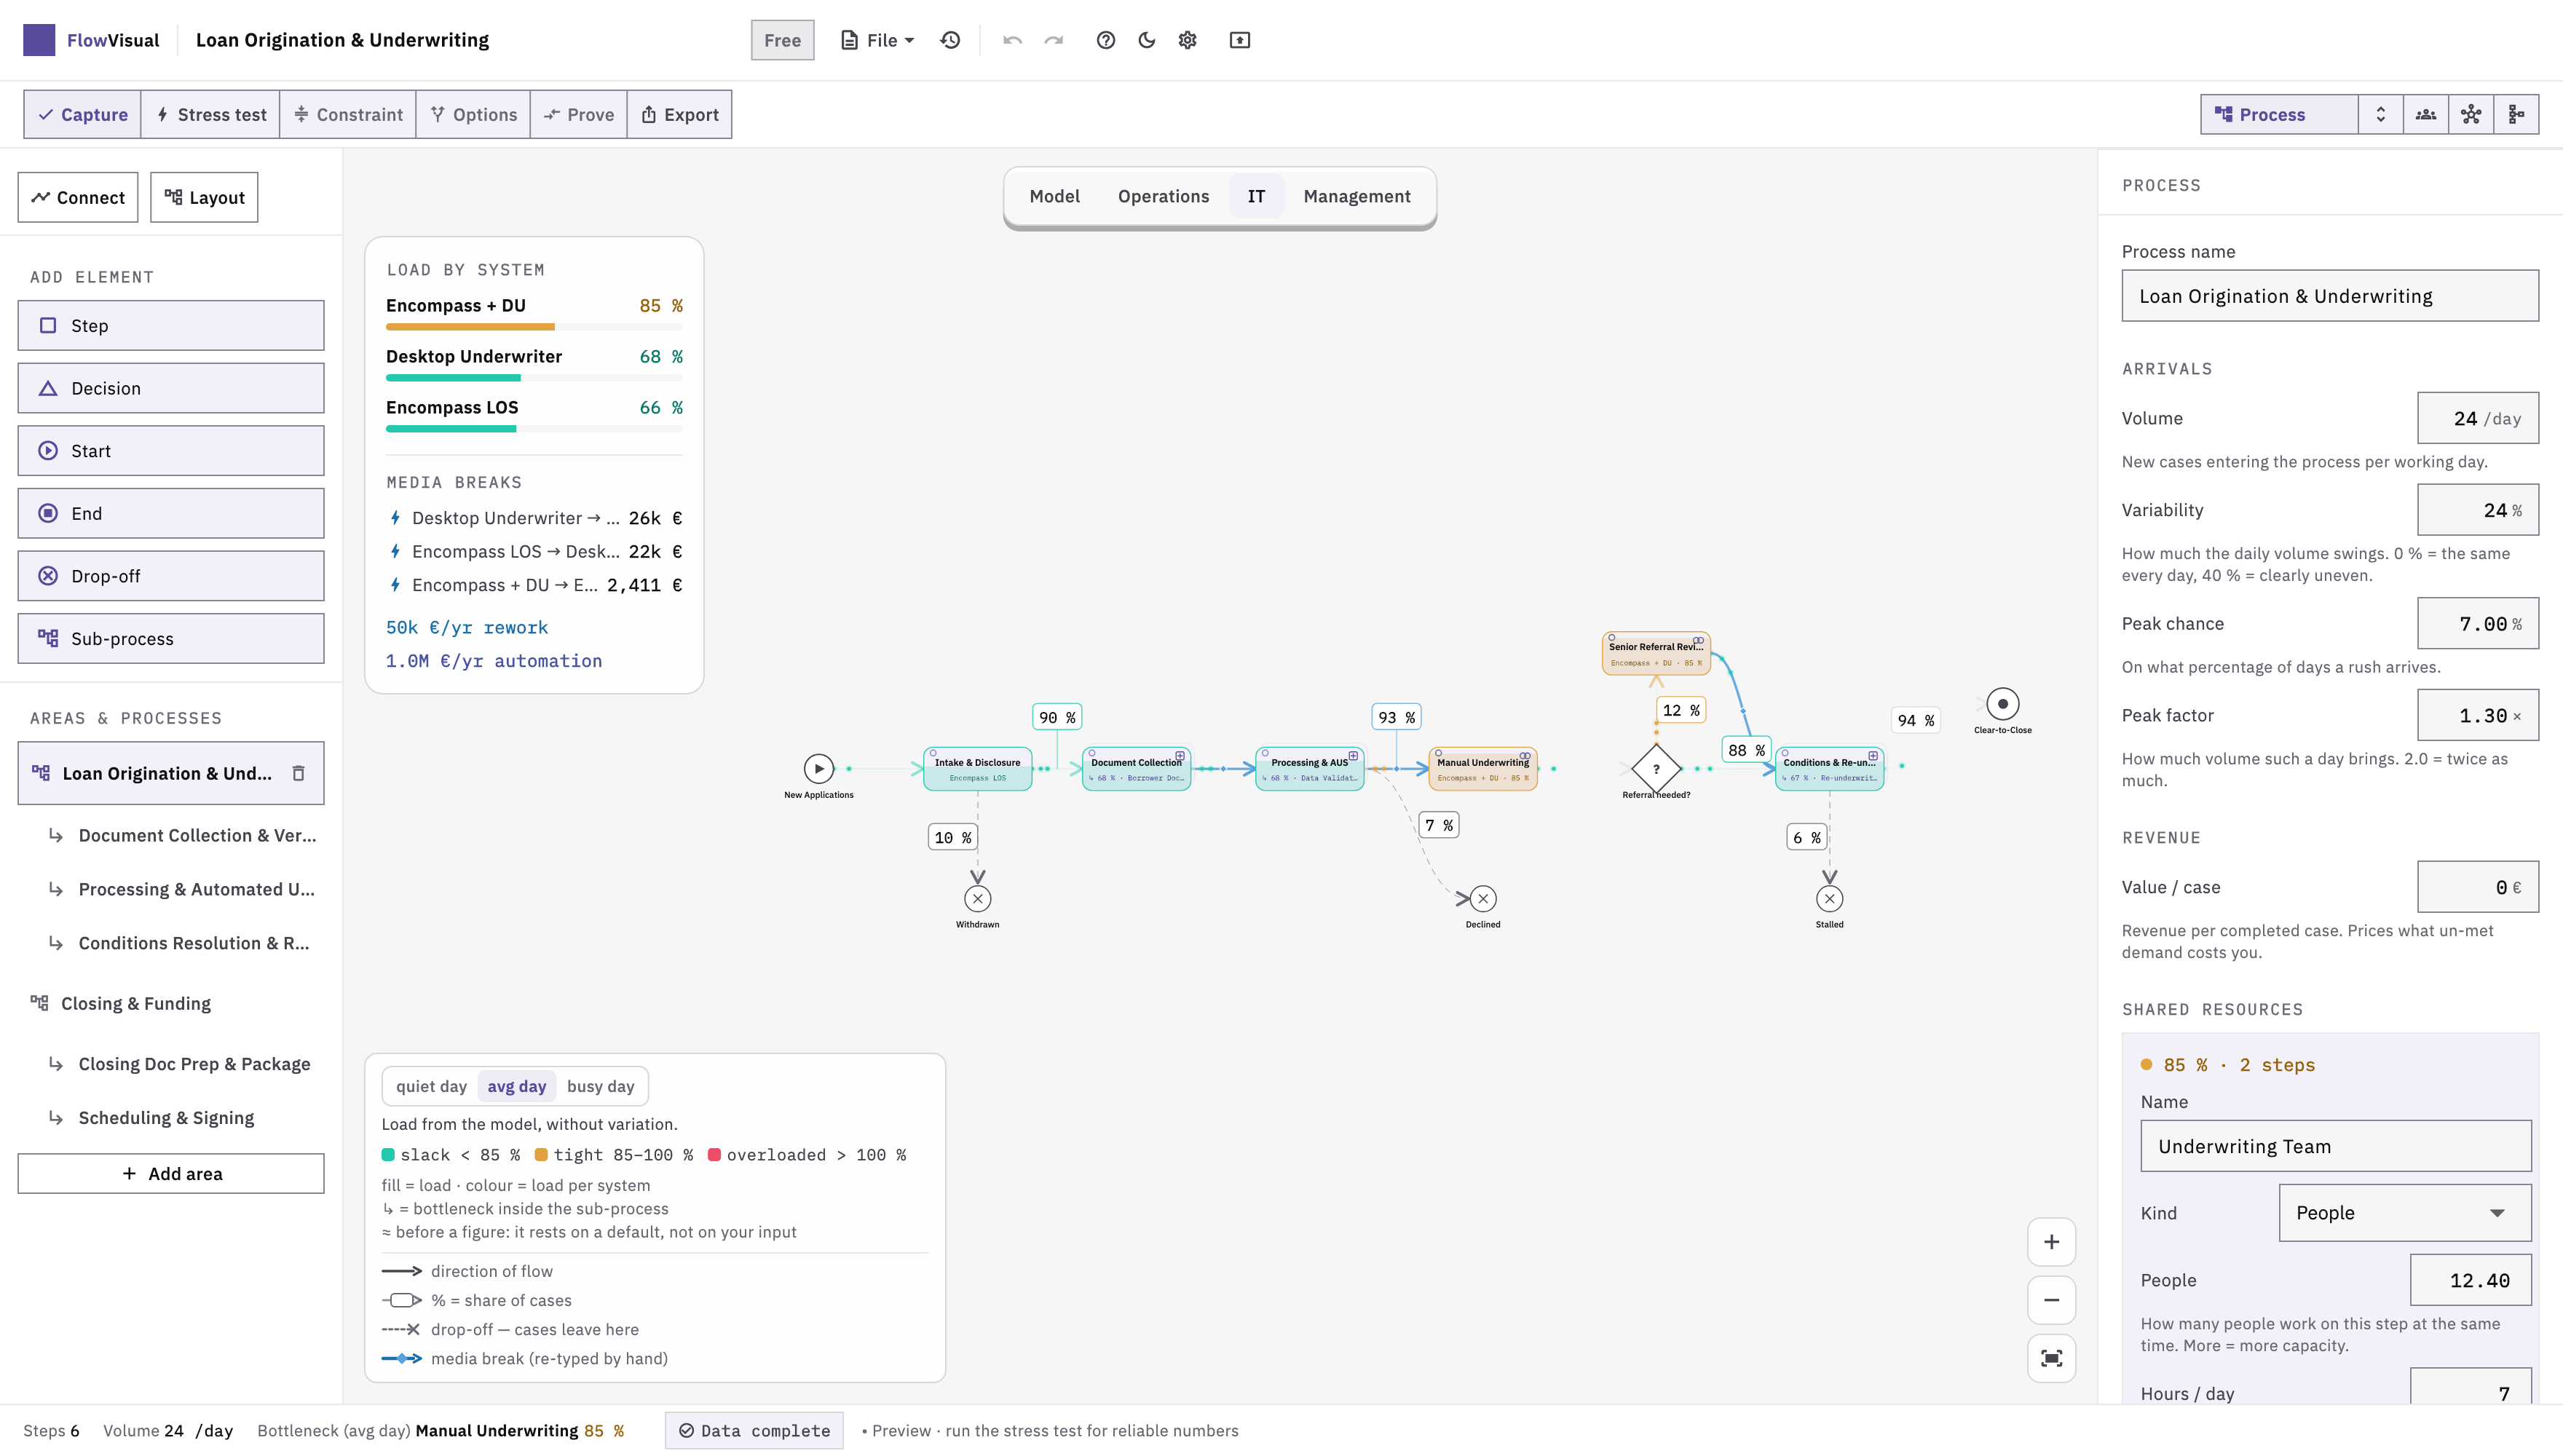
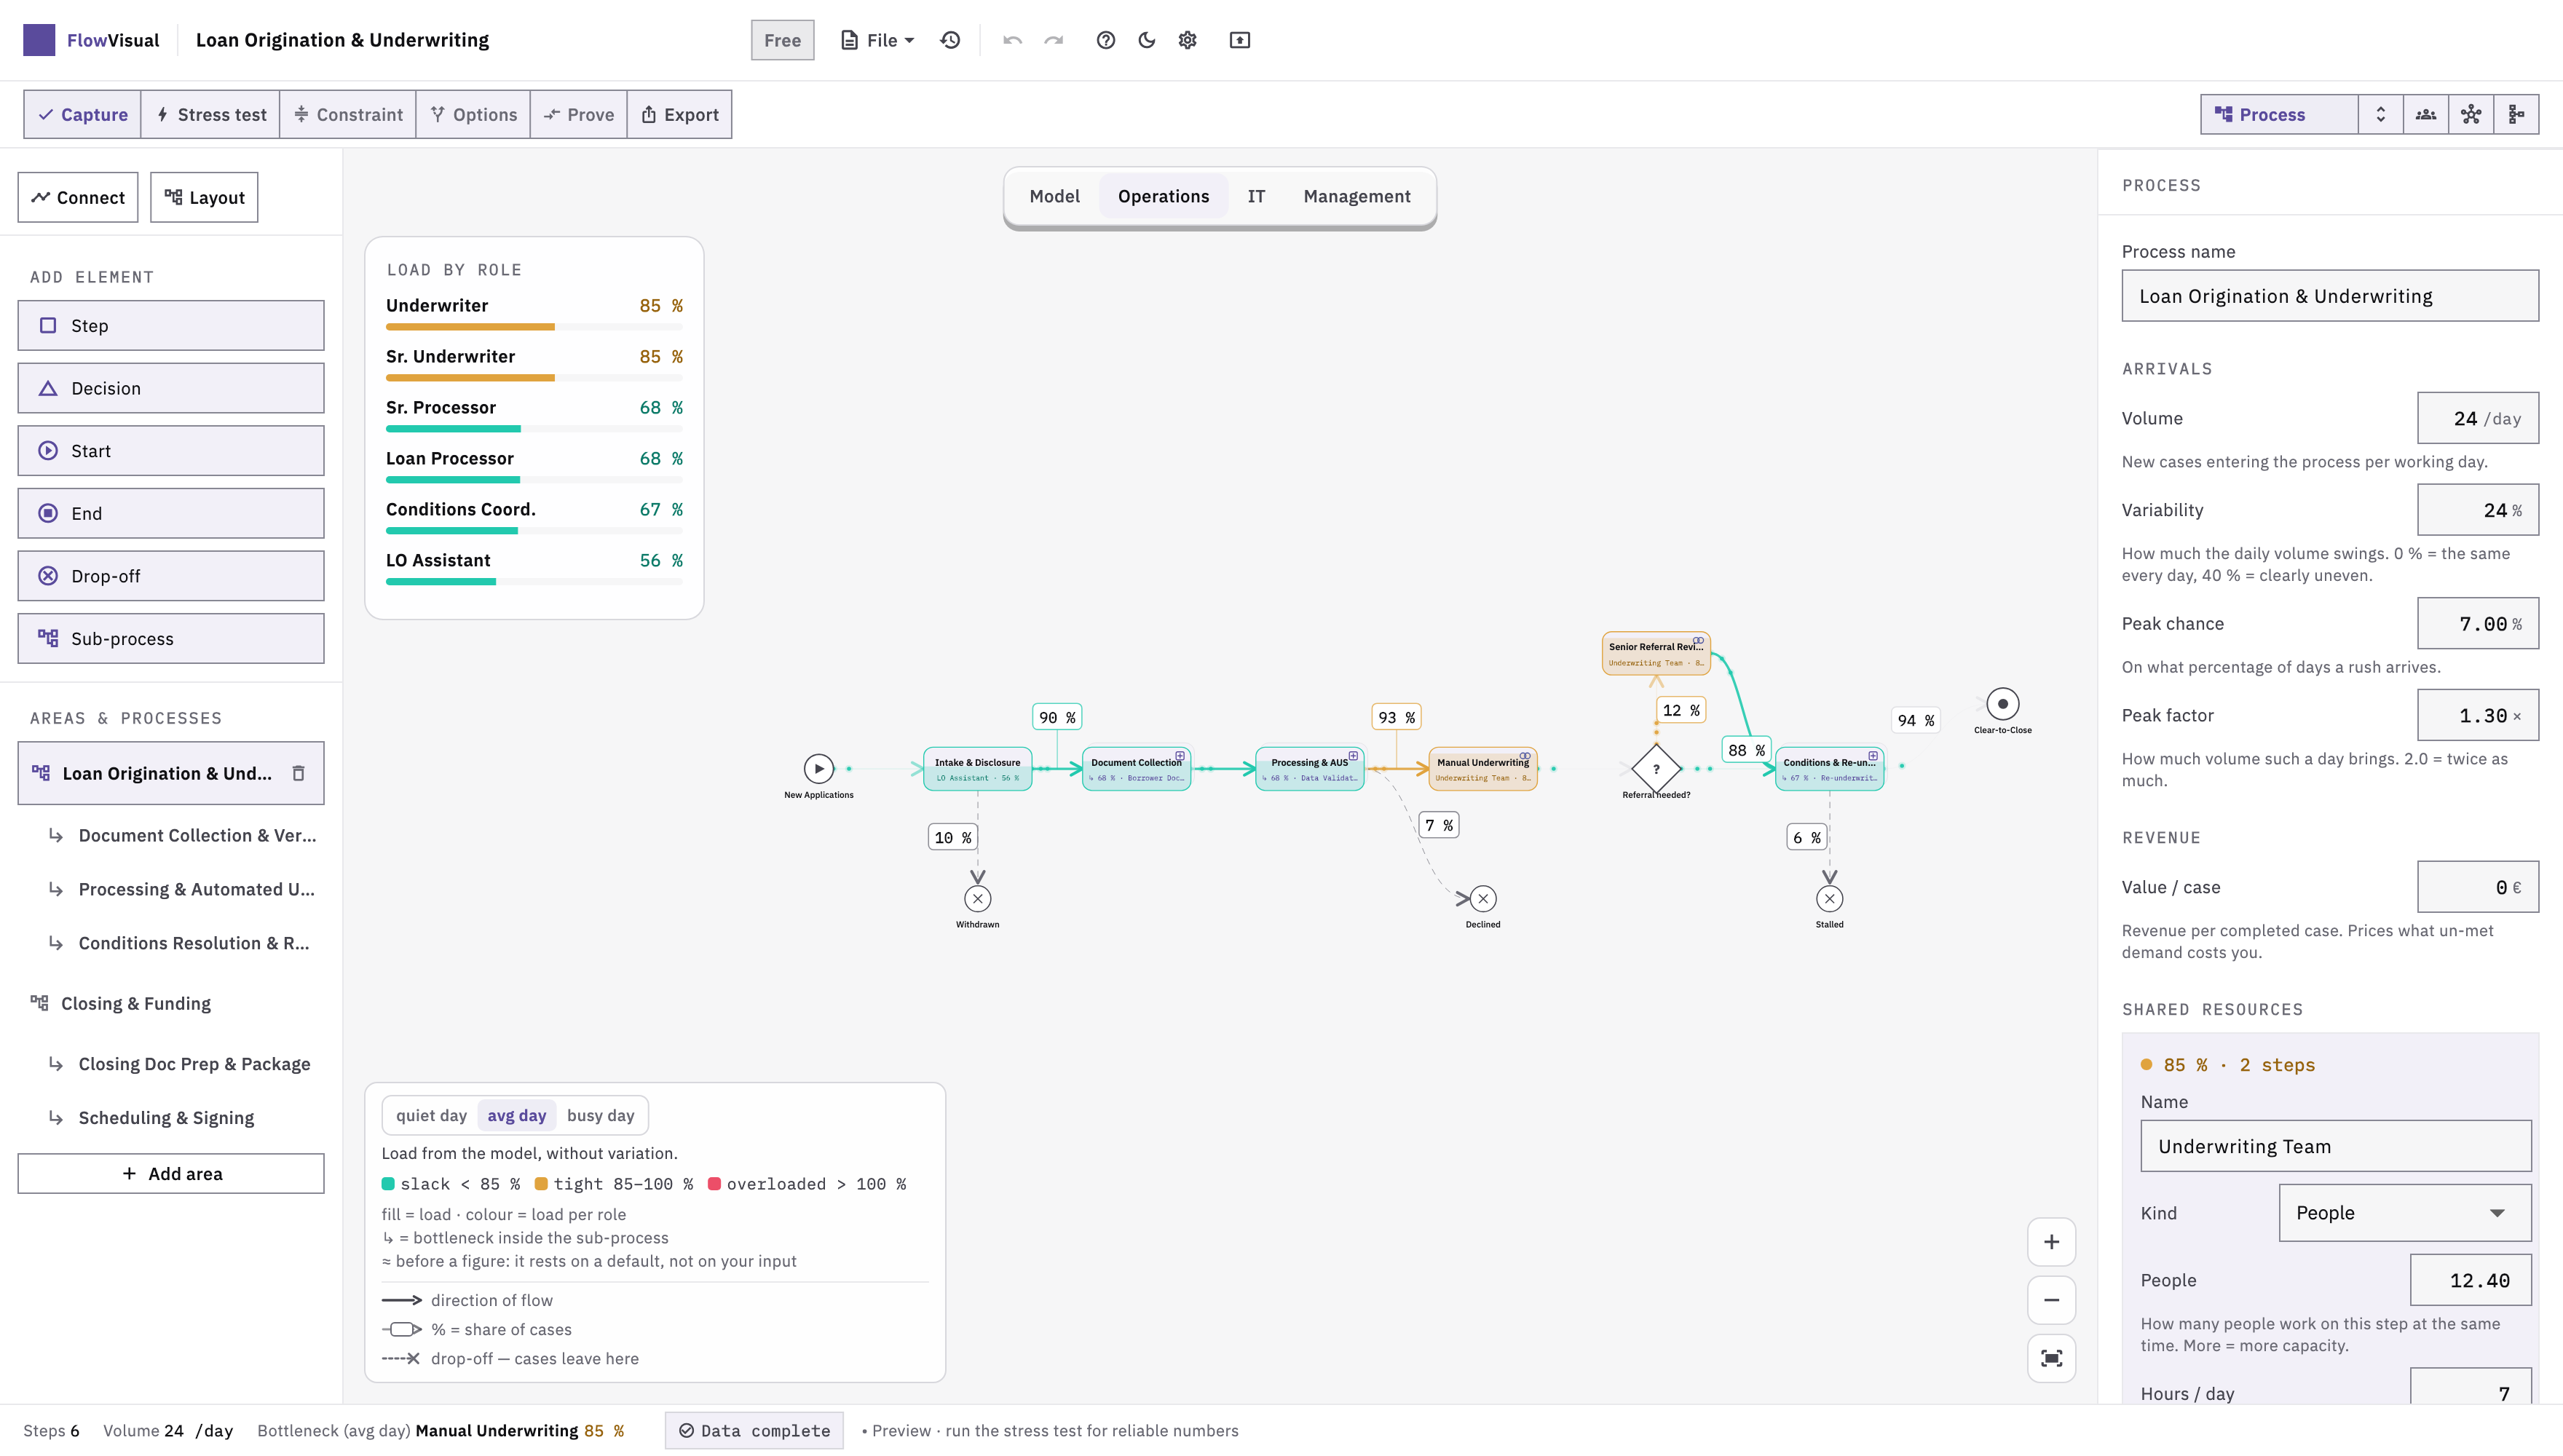
The same process landscape, coloured by load per role. Red means one thing anywhere in the application: more work than capacity.
Capture: steps, decisions, drop-offs, sub-processes. Durations go in as ranges — “8 to 20 minutes”, not a single figure wearing a suit.
Every system a step touches — and the point where one system ends and paper or copy-paste begins.

Crops for the body of an article

A 3520-pixel-wide screenshot is unreadable in a 700-pixel column. These three crops are cut from the same files and stand at full size — each shows exactly one thing.

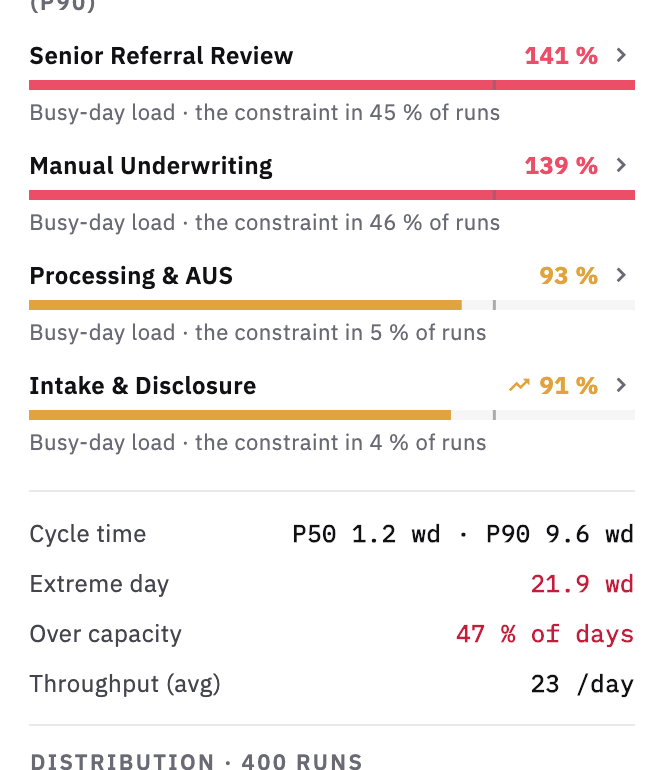
The overloaded steps on a busy day, cycle time as P50 and P90, the share of days over capacity. The extract that fits a fact box.
Where it jamsThe overloaded steps on a busy day, cycle time as P50 and P90, the share of days over capacity. The extract that fits a fact box.
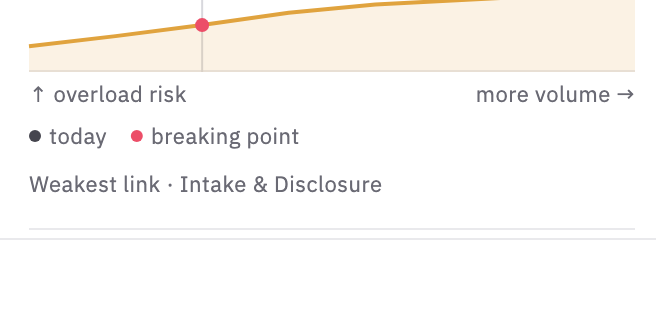
At what volume the process tips. The dot on the curve is where it stands today, the red one is the breaking point.
FragilityAt what volume the process tips. The dot on the curve is where it stands today, the red one is the breaking point.
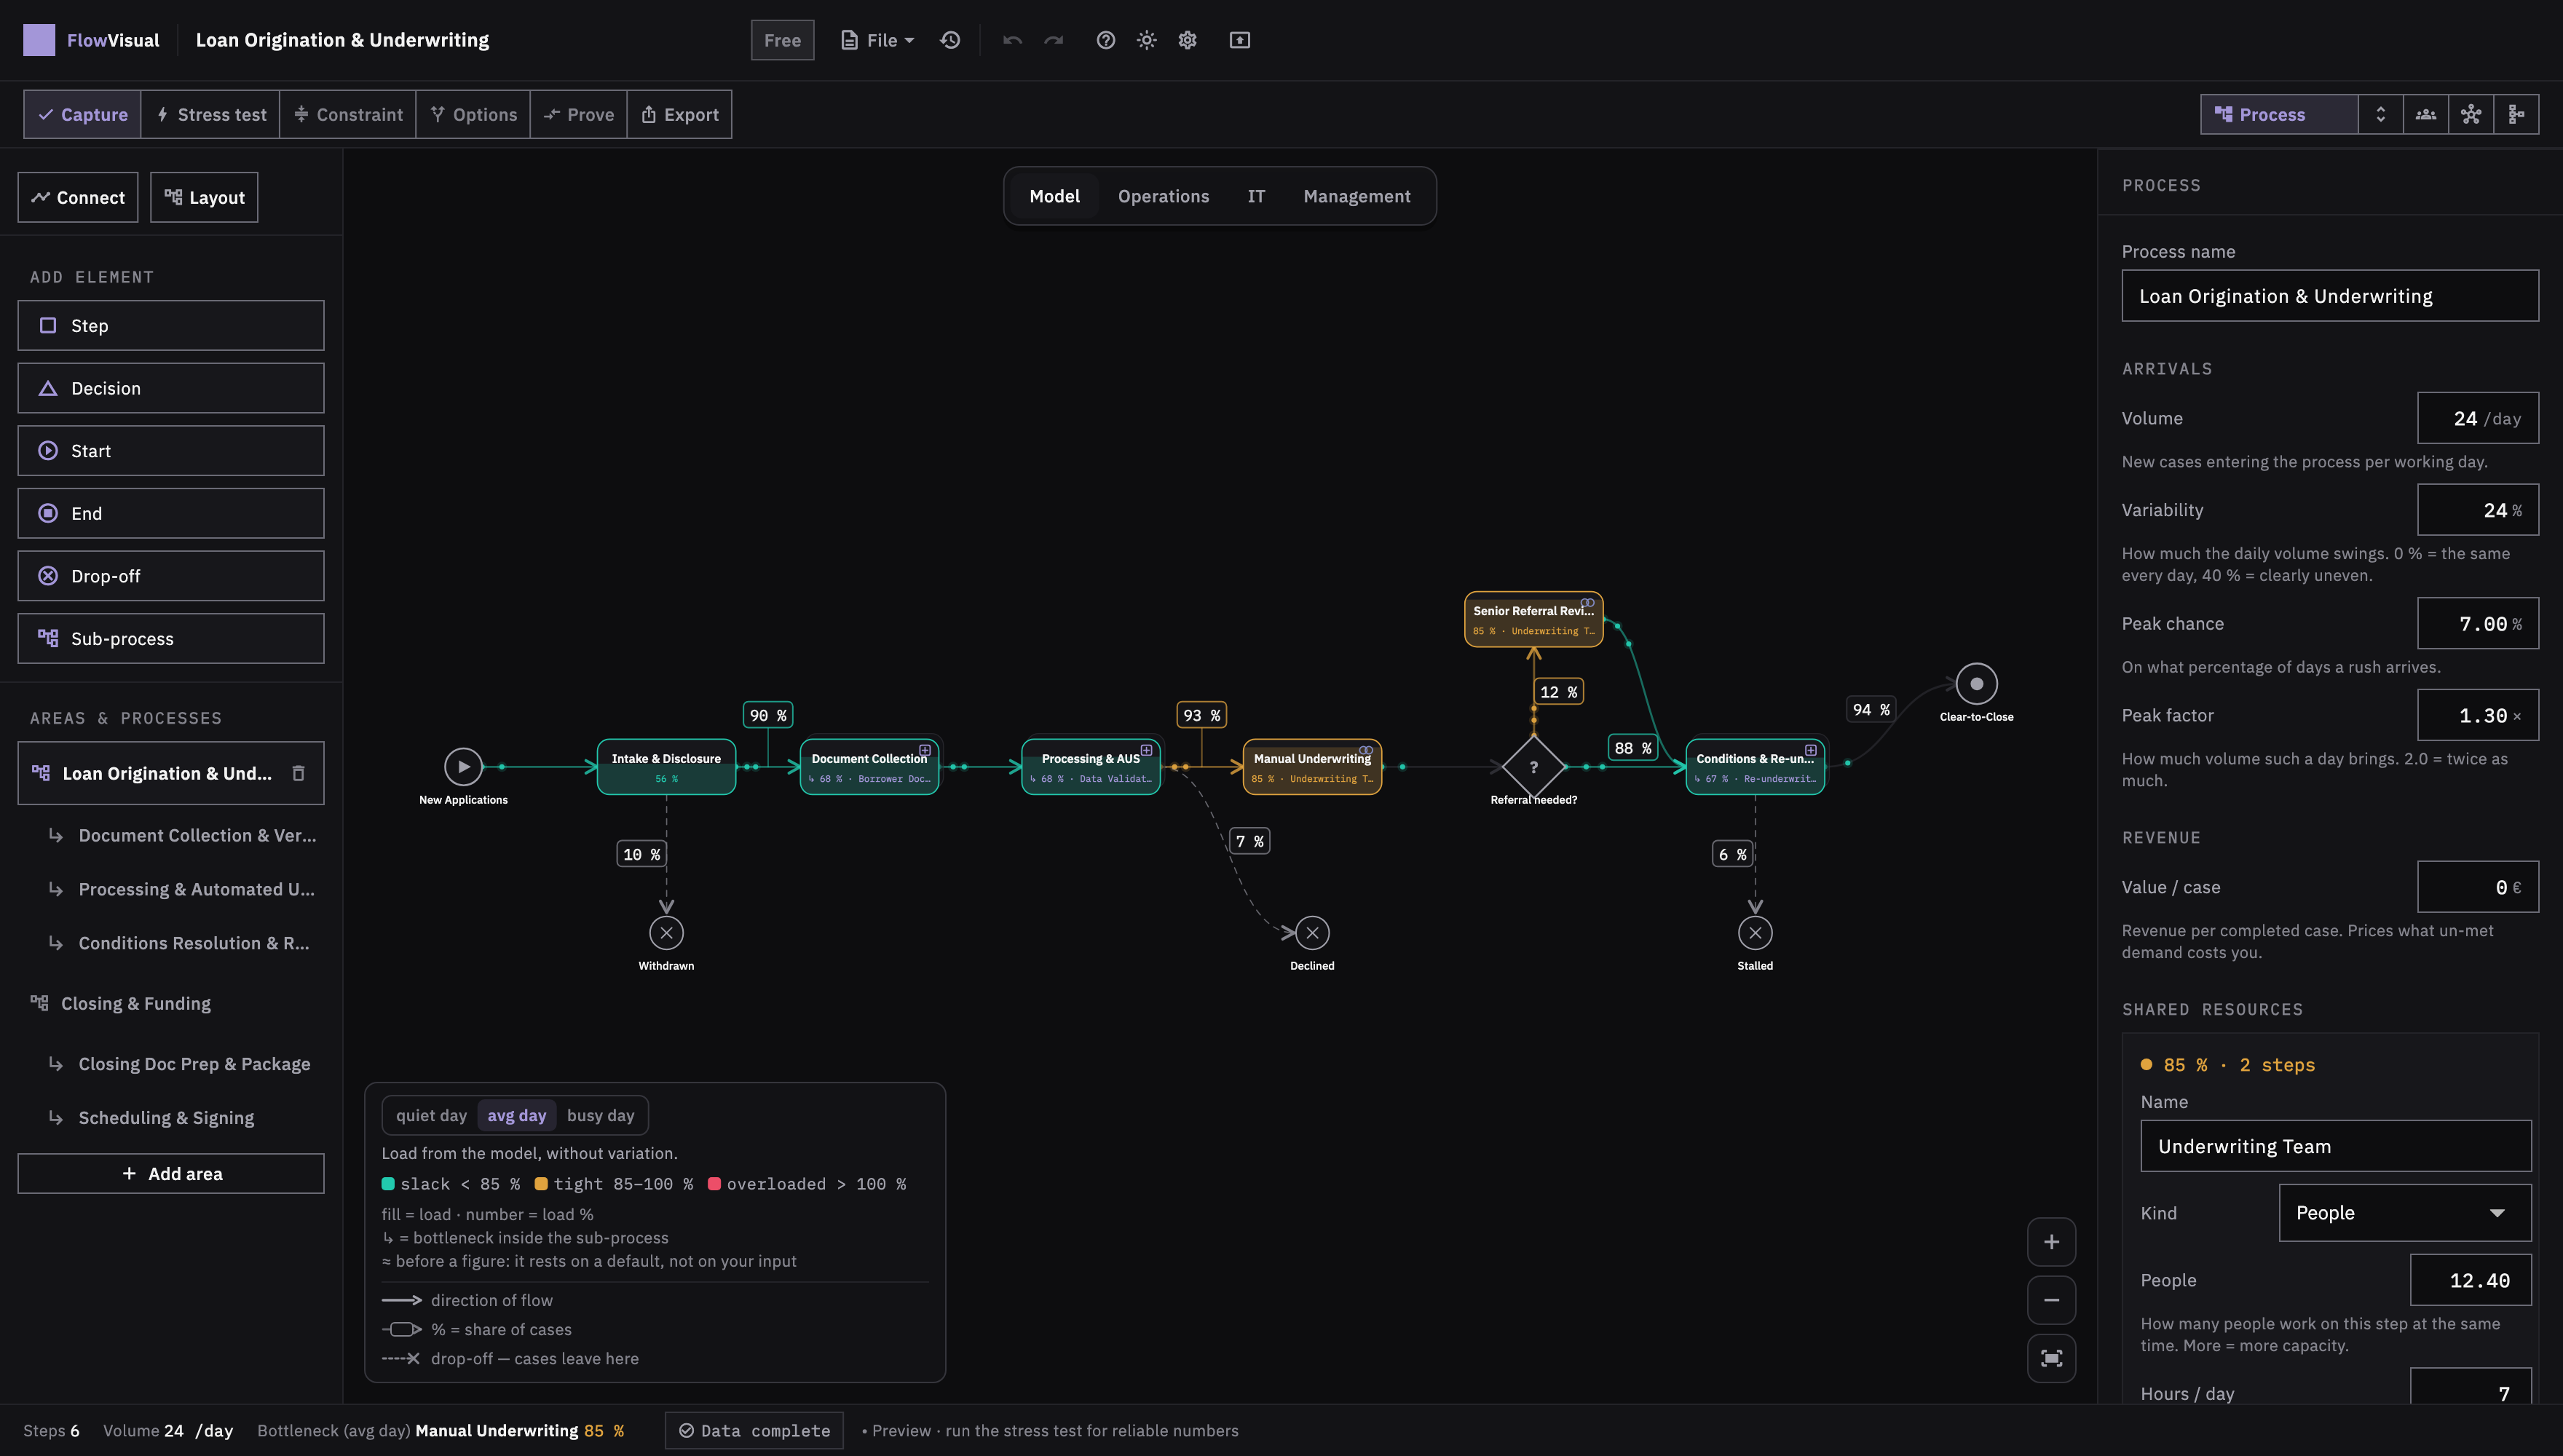
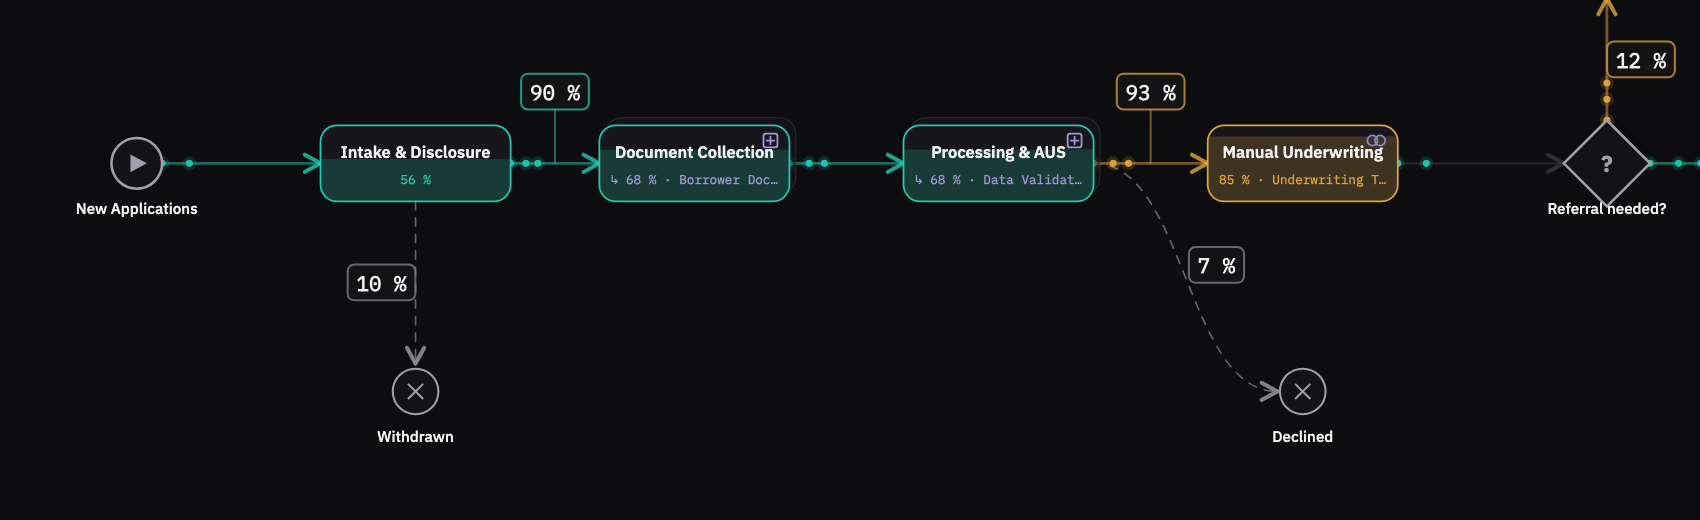
The lead image: cases flow along the chain, drop-offs leave sideways, every step carries its load in the label.
The running processThe lead image: cases flow along the chain, drop-offs leave sideways, every step carries its load in the label.

The mark

The icon is an F whose crossbar is red: the same colour that means “overloaded” inside the application. The accent is violet (#6B5BB0), the typeface is IBM Plex. The wordmark ships as an outlined SVG so it sets correctly without the font installed.

Wordmark, dark typeWordmark, light typeApplication icon, 1024 px
Terms of use
  • Free to use in editorial coverage of FlowVisual — no permission needed, no embargo.
  • Credit: FlowVisual / Balane GmbH.
  • Cropping is fine. Stretching, recolouring or swapping the labels is not.
  • Leave the mark and the icon as they are; do not build them into a logo of your own.
  • Not for advertising, packaging or product comparisons outside editorial coverage.
06Quotes

Cleared for quotation

Use them verbatim, no further sign-off. For an interview or a question of your own, the contact is below.

A process diagram is a claim. The moment you run it, it becomes checkable — and in most workshops the result surprises the person who drew the diagram first.

Jonas David Höttler, Managing Director, Balane GmbH
The sentence the whole application hangs on: nobody should ever have to guess where a change takes effect. That is why we never add savings together but re-simulate the whole model for each variant. It is the only way to see that the second measure buys nothing because the first already moved the constraint.

Jonas David Höttler, Managing Director, Balane GmbH
We never report a single number. A saving without a range is the first thing a sceptical room takes apart — and rightly so.

Jonas David Höttler, Managing Director, Balane GmbH
The tool has to hold up in the room where the decision is made. That is why there is a presentation mode and no slide export: the question from the table gets answered on the running model, not deferred to the next meeting.

Jonas David Höttler, Managing Director, Balane GmbH
07Limits

What we explicitly do not claim

This section is here to shorten your research. Check any of these limits and you will find them exactly as stated.

No user or customer numbers

We publish no install counts, no reference logos and no case studies with client names. Not out of secrecy — we have no defensible figures. If you need one for the article, you will not get it here, and not from anyone else either.

No process mining

FlowVisual reads no event logs out of ERP systems and watches nobody's screen. The figures come from the people who do the work. That is a decision: needing no data project first is the selling point, not the gap.

No AI that invents your process

The application can read documents, but only through an AI endpoint you supply yourself, under a citation rule — and nothing enters the model before you accept it line by line. A built-in chat assistant is not shipped.

No cloud, no real-time collaboration

There is no account, no server, no simultaneous editing. A team shares a project folder on its own drive. Anyone looking for approval workflows and a process repository is looking for a different product.

A simulation is not the truth

The result is only as good as the input. The application says so itself: while figures are estimates it marks the result “provisional”, and the proposal states what each number rests on — client statement, estimate or measurement.

No substitute for the consultant

The tool finds the constraint and prices the change. Which process to touch at all, and what the organisation can absorb, is still a human decision. The method behind it lives on flowrefy.com, not in the application.

08Contact

Review key, demo, questions

Review keys for the Pro version are free for editorial staff and trade writers — with no strings attached to your coverage and no question about what you intend to write.

Where to download it

Both stores carry the same version, and one licence key covers both. Modelling and simulating need no account and no key — for a review, the free scope reaches all the way to a finished PDF.

Signed installers, no store account

macOS 13 or newer (Apple Silicon and Intel) · Windows 10/11 (64-bit)

Fifteen minutes to a verdict

The shortest route to the point where you can judge whether the tool is any good:

  1. 01Download FlowVisual and open it — modelling and simulating need no key.
  2. 02Open a finished process from the template gallery instead of drawing one.
  3. 03Start the stress test. One run takes the model through thousands of days.
  4. 04Switch to “busy day” and read off the constraint — the red step.
  5. 05Move to the options grid: proposed variants, each re-simulated in full.
  6. 06Adopt one variant and read Before and After side by side.
  7. 07Generate the proposal PDF. Without a licence it still carries the real figures, marked as a trial.