Most tools let you draw a process. This one lets it run.
Model your process in minutes, run it under real load, and watch the bottleneck surface. Then change one step, and FlowVisual tells you what that change is worth in time and money.
Modelling and stress testing are free forever. No account, no cloud.
Here is the point: the bottleneck does not stay put.
Same process, three situations. Switch between them and watch the queue move. A spreadsheet never shows you that movement, and the entire investment decision hangs on it.
- Throughput
- —/ d
- Lead time
- —
- Bottleneck
- —
- Waiting
- —
Review done by hand. Everything piles up before step 3.
- slack
- tight
- overloaded
A simplified illustration of the principle. Inside the app, a discrete-event simulator runs on your volumes, capacities and variability.
A process is not a sum.
Five steps of ten minutes each do not add up to fifty minutes of lead time. They add up to queues, peak days and one step that throttles everything else. A spreadsheet cannot compute that, which is exactly why optimisations built on spreadsheets fail.
- 01
Averages lie in operations
No case takes exactly 7.5 minutes. It takes 5 to 10, and 18 on a peak day. FlowVisual works with ranges, not with a wishful number.
- 02
The bottleneck governs everything
Improving any other step returns nothing. You need to know which step is the constraint and where it moves once you relieve it.
- 03
Second-order effects decide
Automate the review and you shift the load onto approval. That knock-on effect is the difference between a business case and a disappointment.
Four steps from a sketch to a number that holds
Everything in the product serves a single loop. If a feature doesn't, it isn't in here.
- 01
Model
Assemble steps, decisions, drop-offs and sub-processes by clicking. Volumes and durations as ranges, 5 to 10 minutes instead of a fake 7.5. No notation to learn.
- 02
Stress-test
Hundreds of Monte Carlo runs show which step is most likely to become the constraint: lead time as a P10–P90 band, throughput, and the share of days that exceed capacity.
- 03
Improve
Change one step (capacity, automation level, routing) and see the consequence immediately. Including the one you didn't expect: the bottleneck moves.
- 04
Prove
Before/after in money and time, with a P10–P90 band. As a branded proposal PDF and a documentation handbook, both in one click.
One model, four lenses
Business, IT and management read the same twin, each in their own language. No second document, nothing lost in translation.
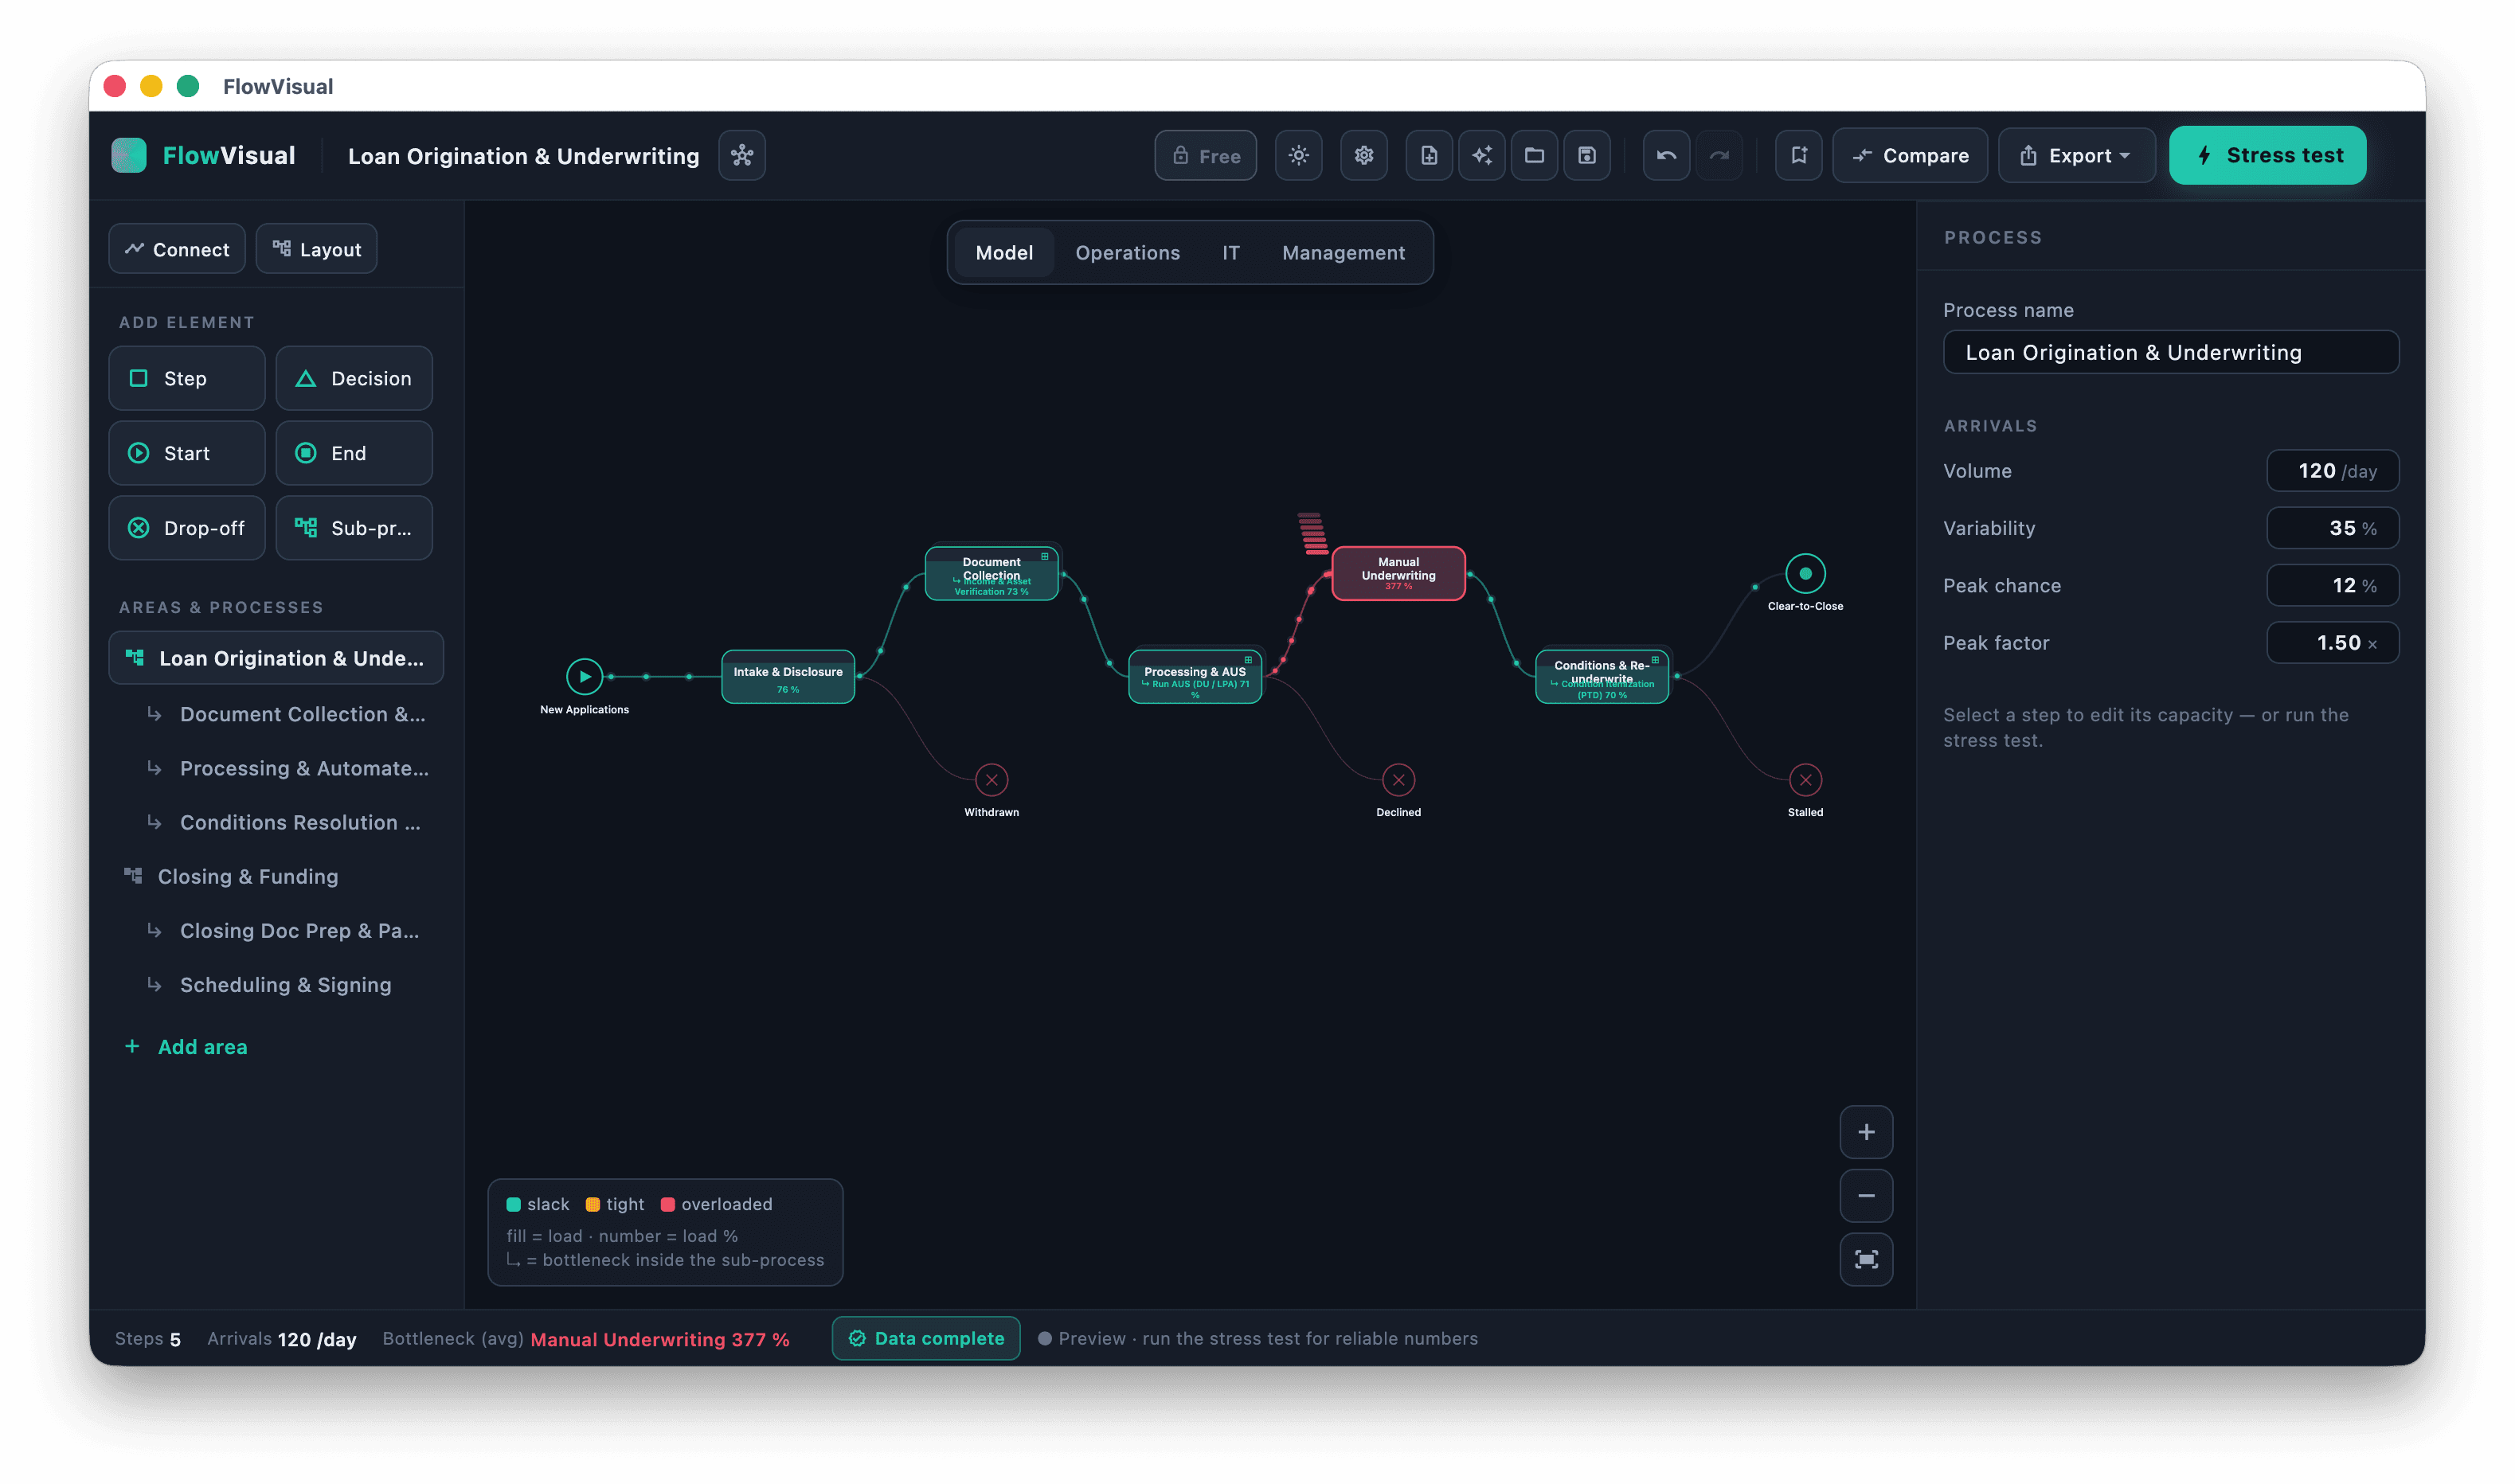
The process as it actually runs
- Areas and sub-processes cleanly structured
- Edges carry arrowheads and their percentages in the diagram
- Bottleneck highlighted while you are still drawing
Building blocks instead of BPMN notation: step, decision, start, end, drop-off, sub-process. Fill shows load, the number shows utilisation, colour shows state. Rework loops run dashed underneath the process, visible and not hidden.
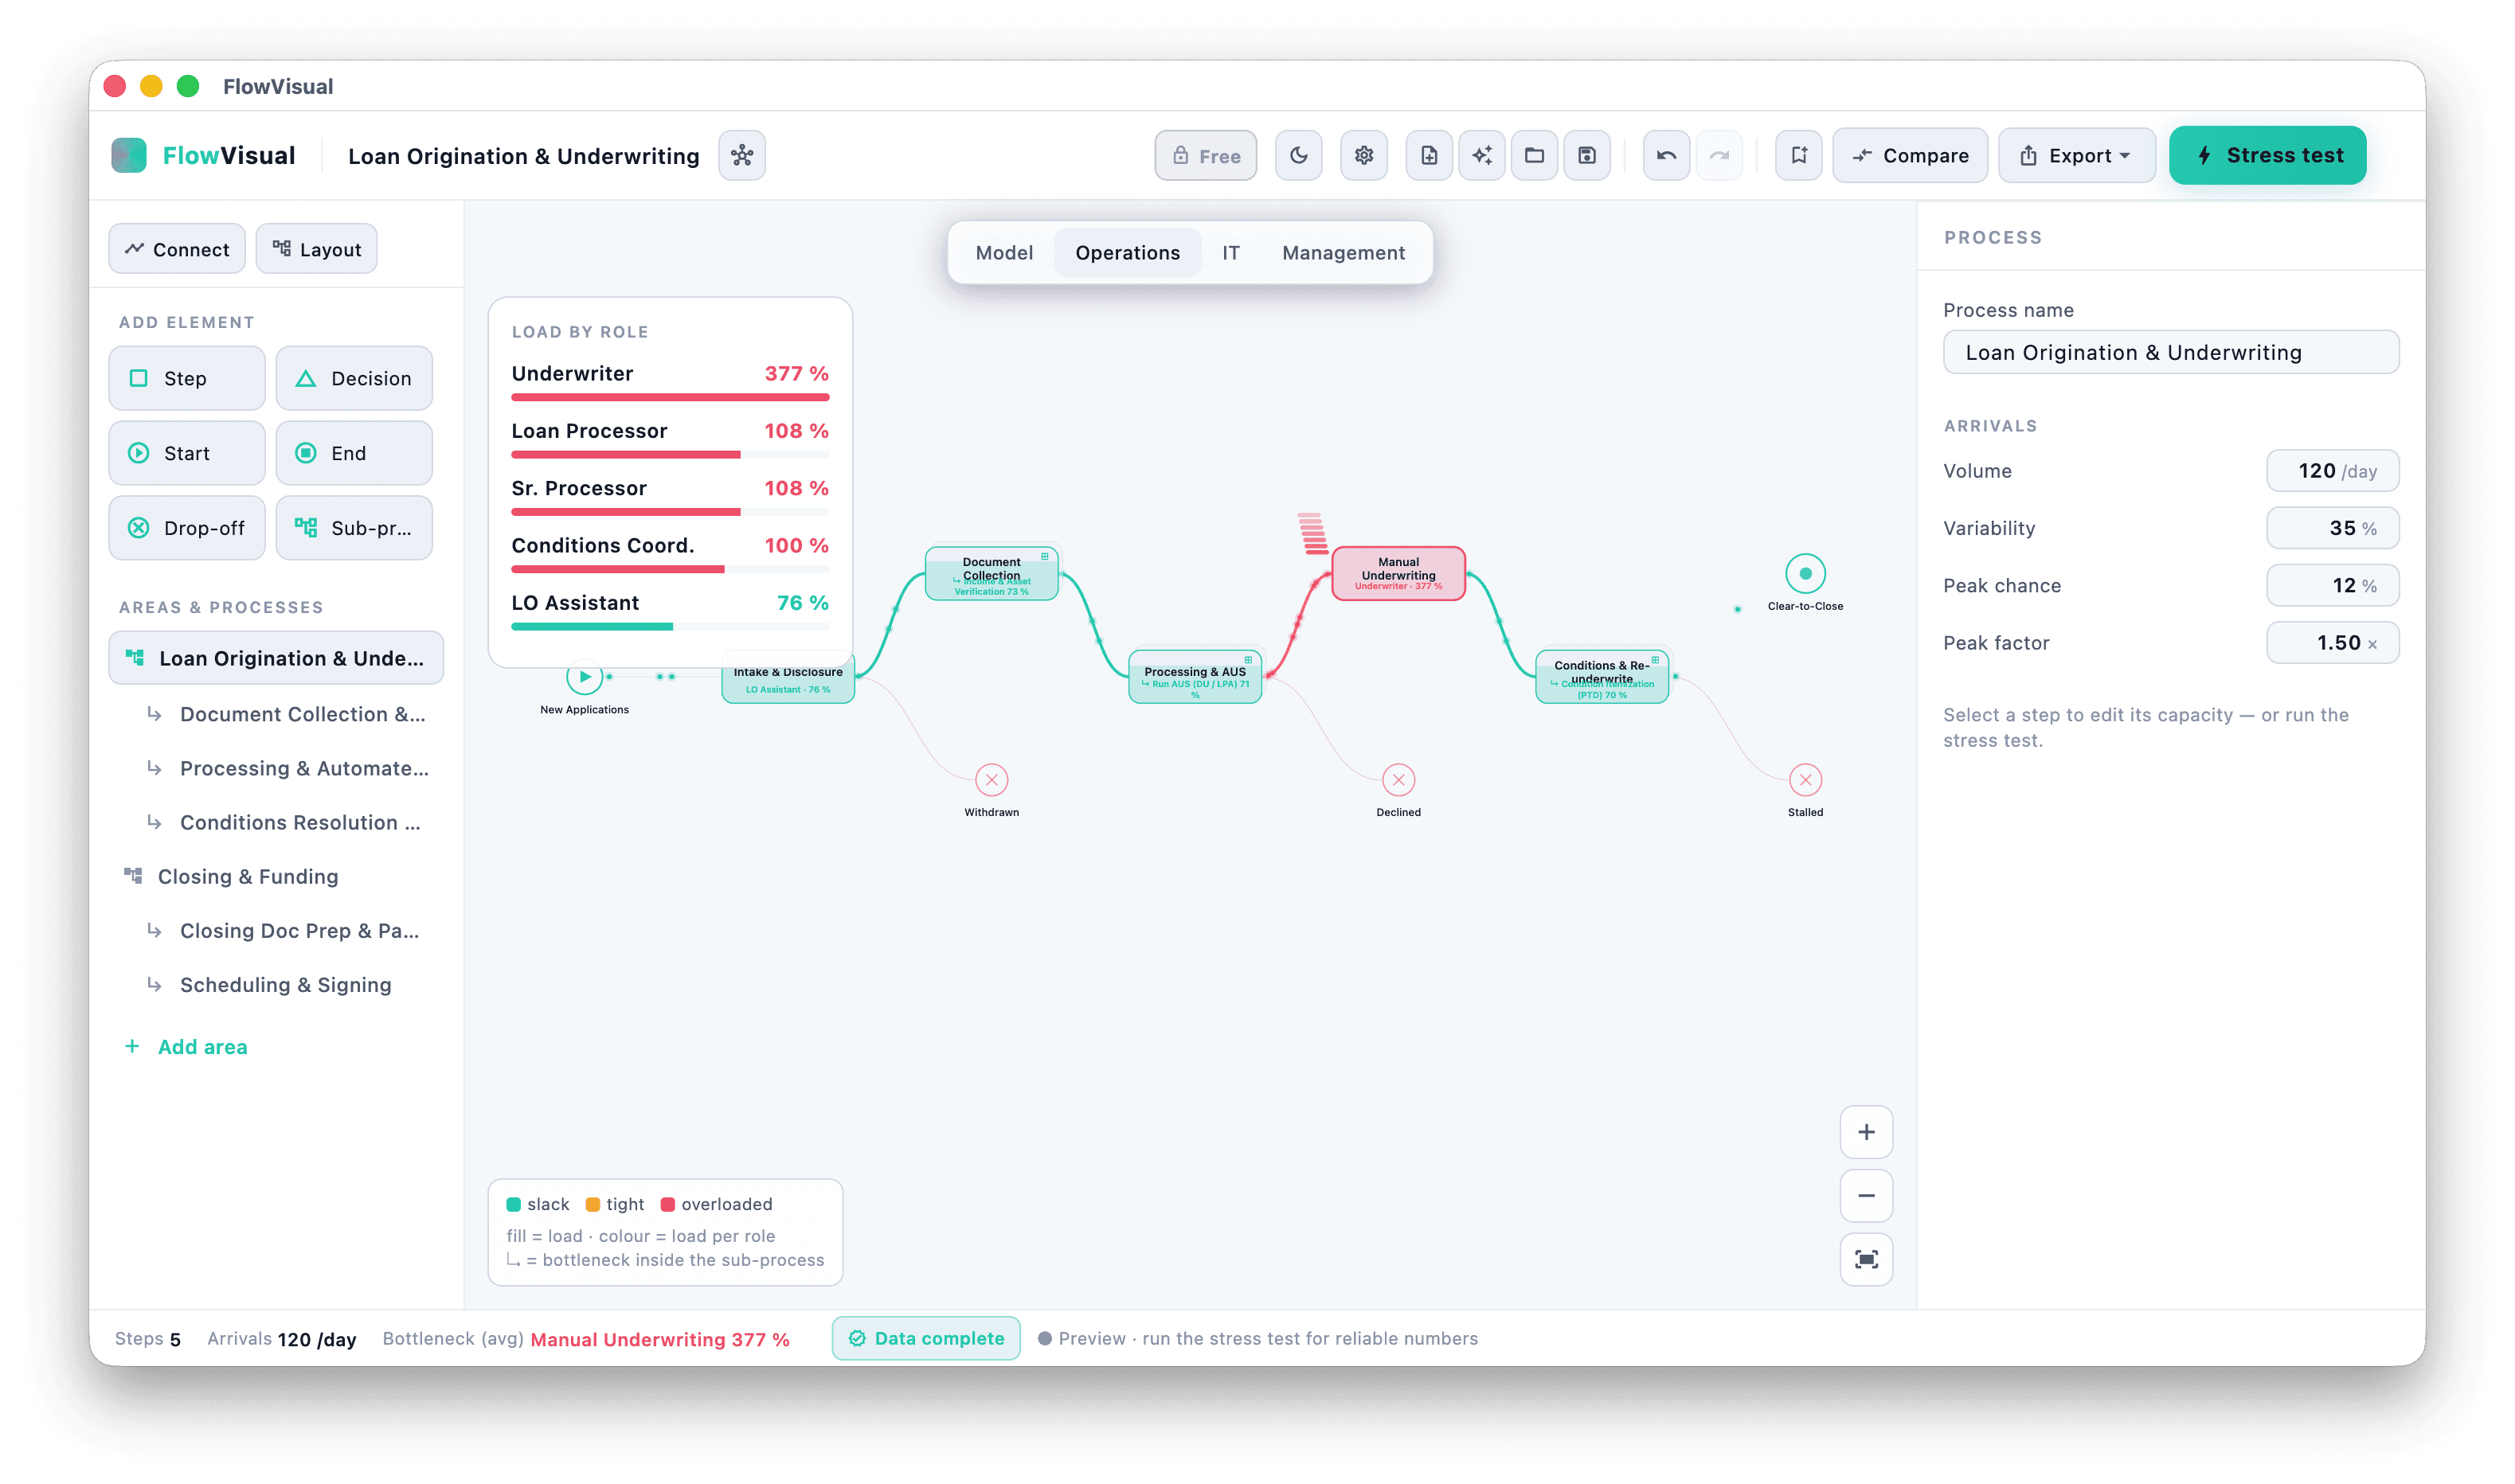
Who is overloaded, who has slack
- Utilisation per role, colour-coded
- Shared resources treated as a pool, not as separate maths
- Evidence for redistribution instead of gut feel
Utilisation per role in percent, measured on the peak day (P90), not as a monthly average, where every overload disappears. This is the basis for redistributing work before you talk about new hires.
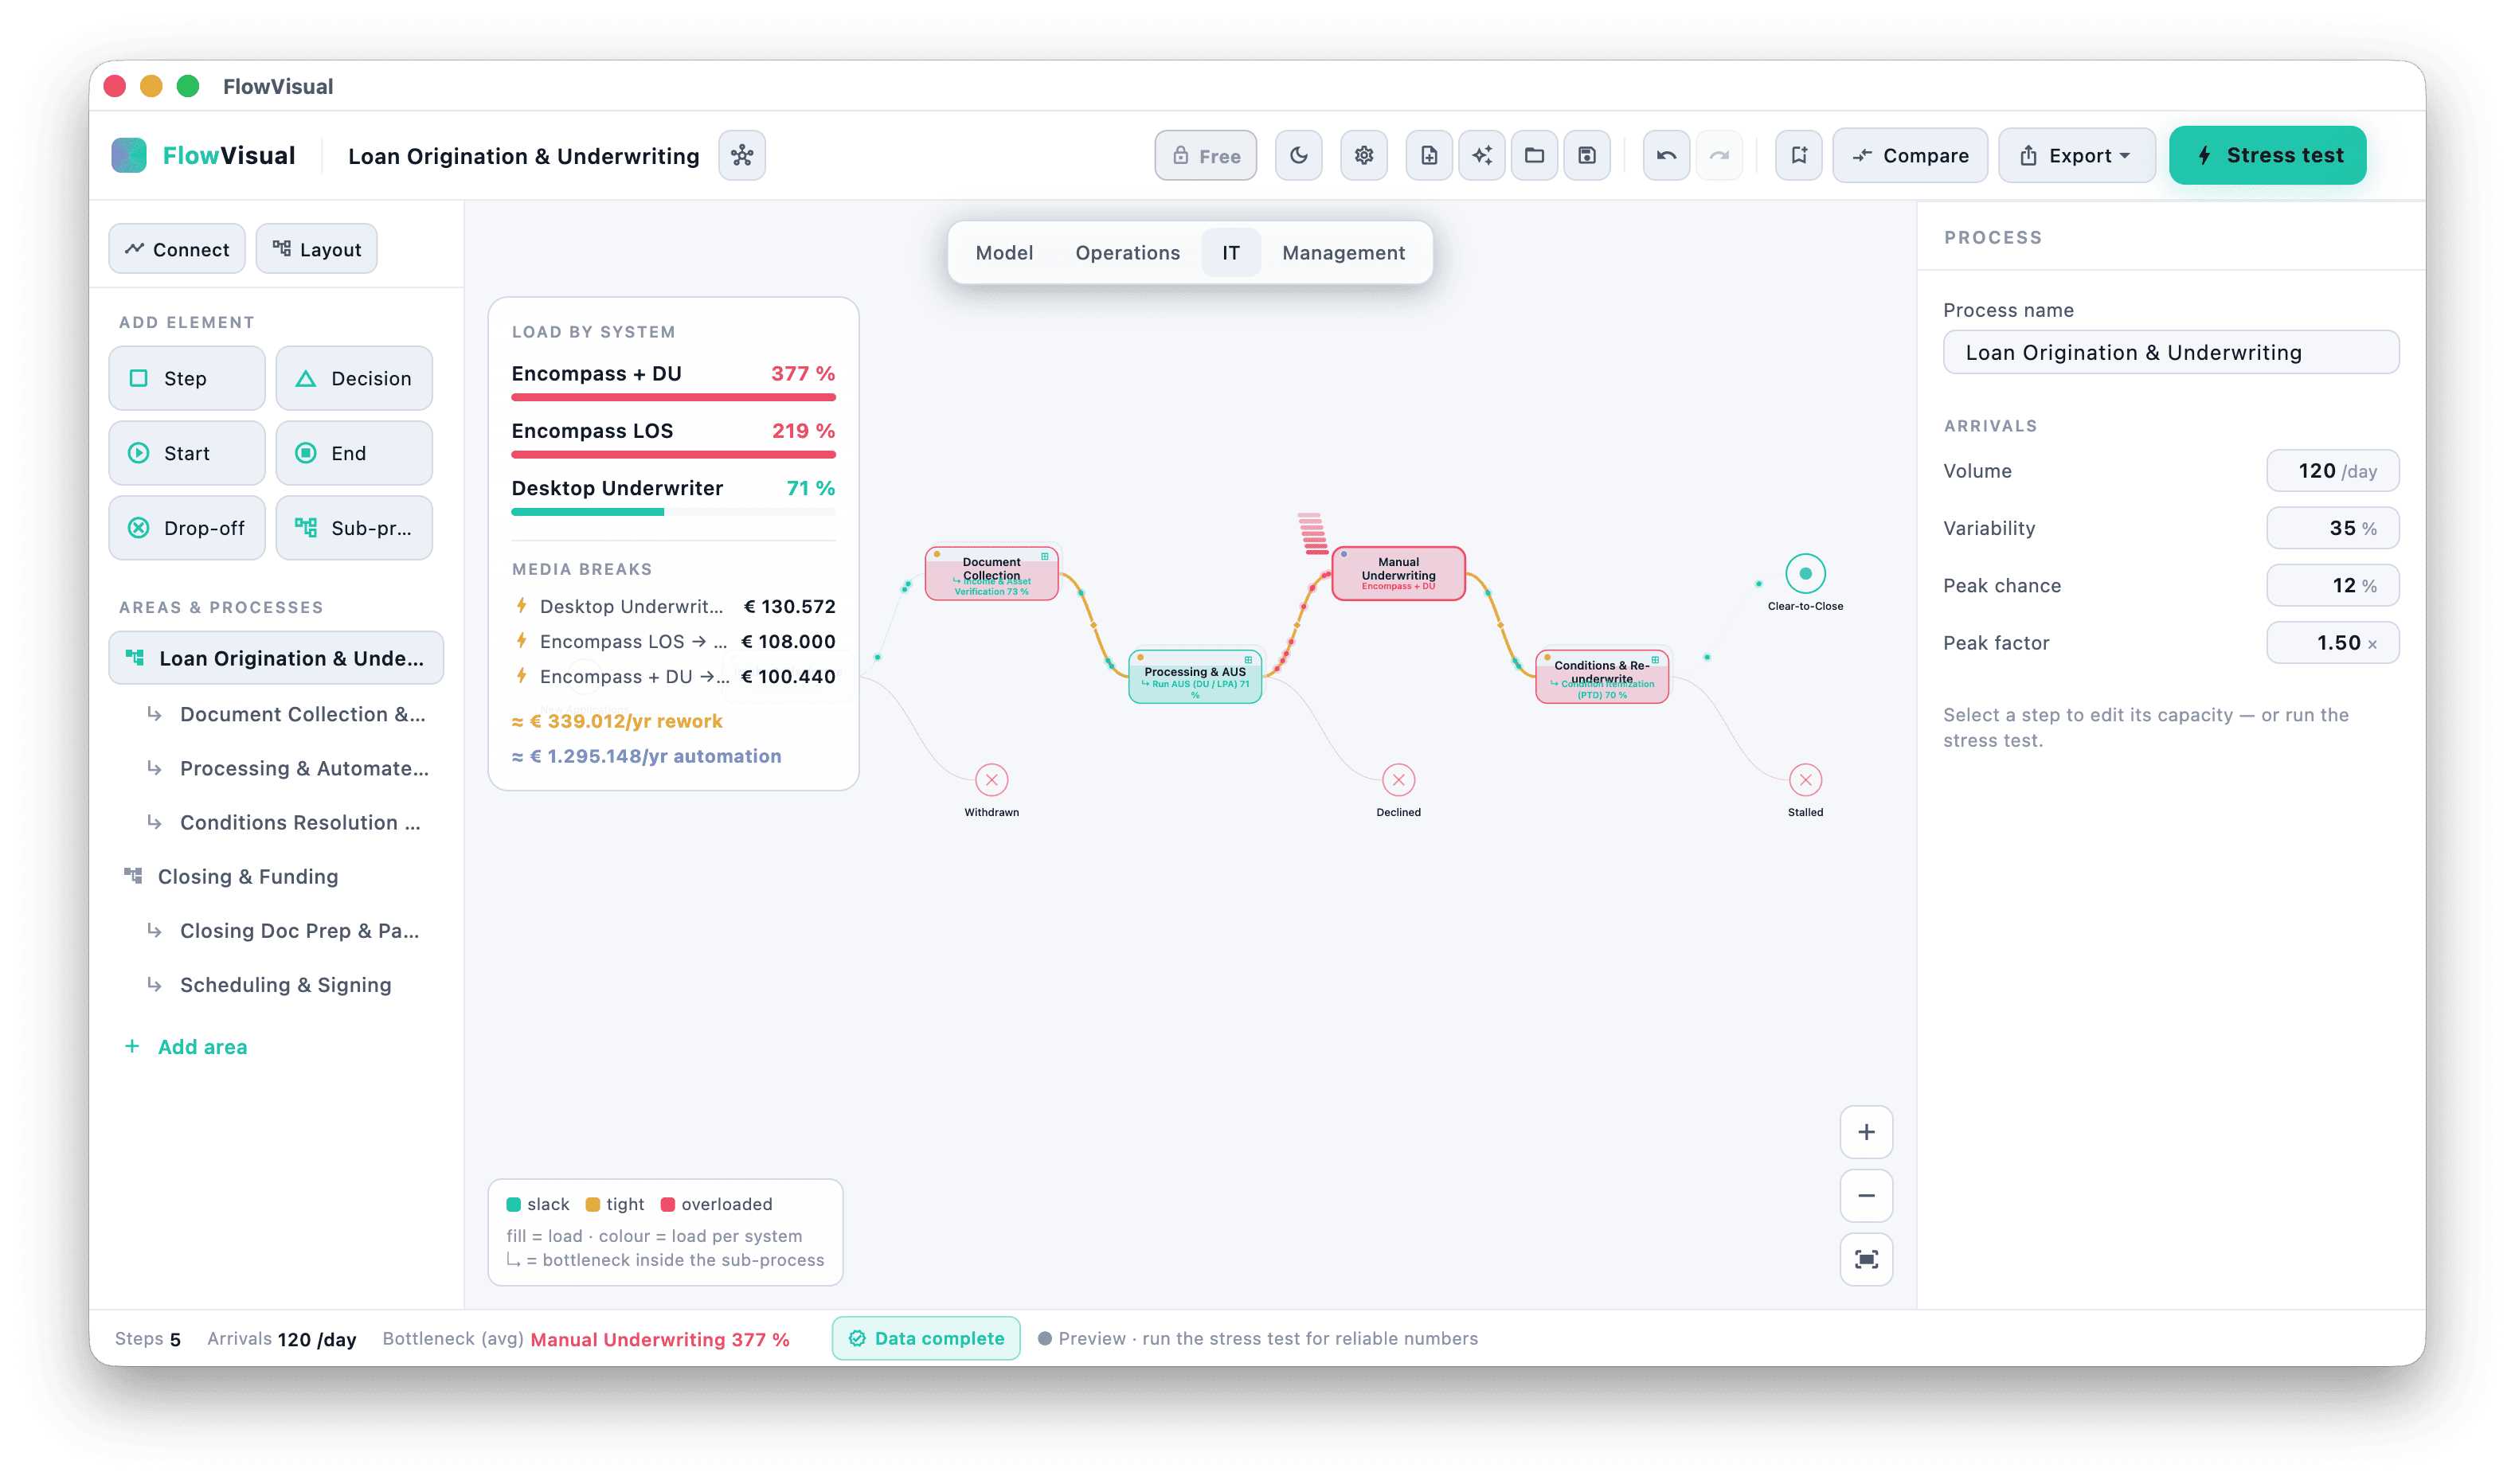
System breaks and what they cost
- System load alongside people load
- Media breaks named, not estimated
- Automation potential in euros per year
Load per system, not just per person. Wherever data is retyped from one system into the next, it becomes visible, including rework and automation potential in euros per year.
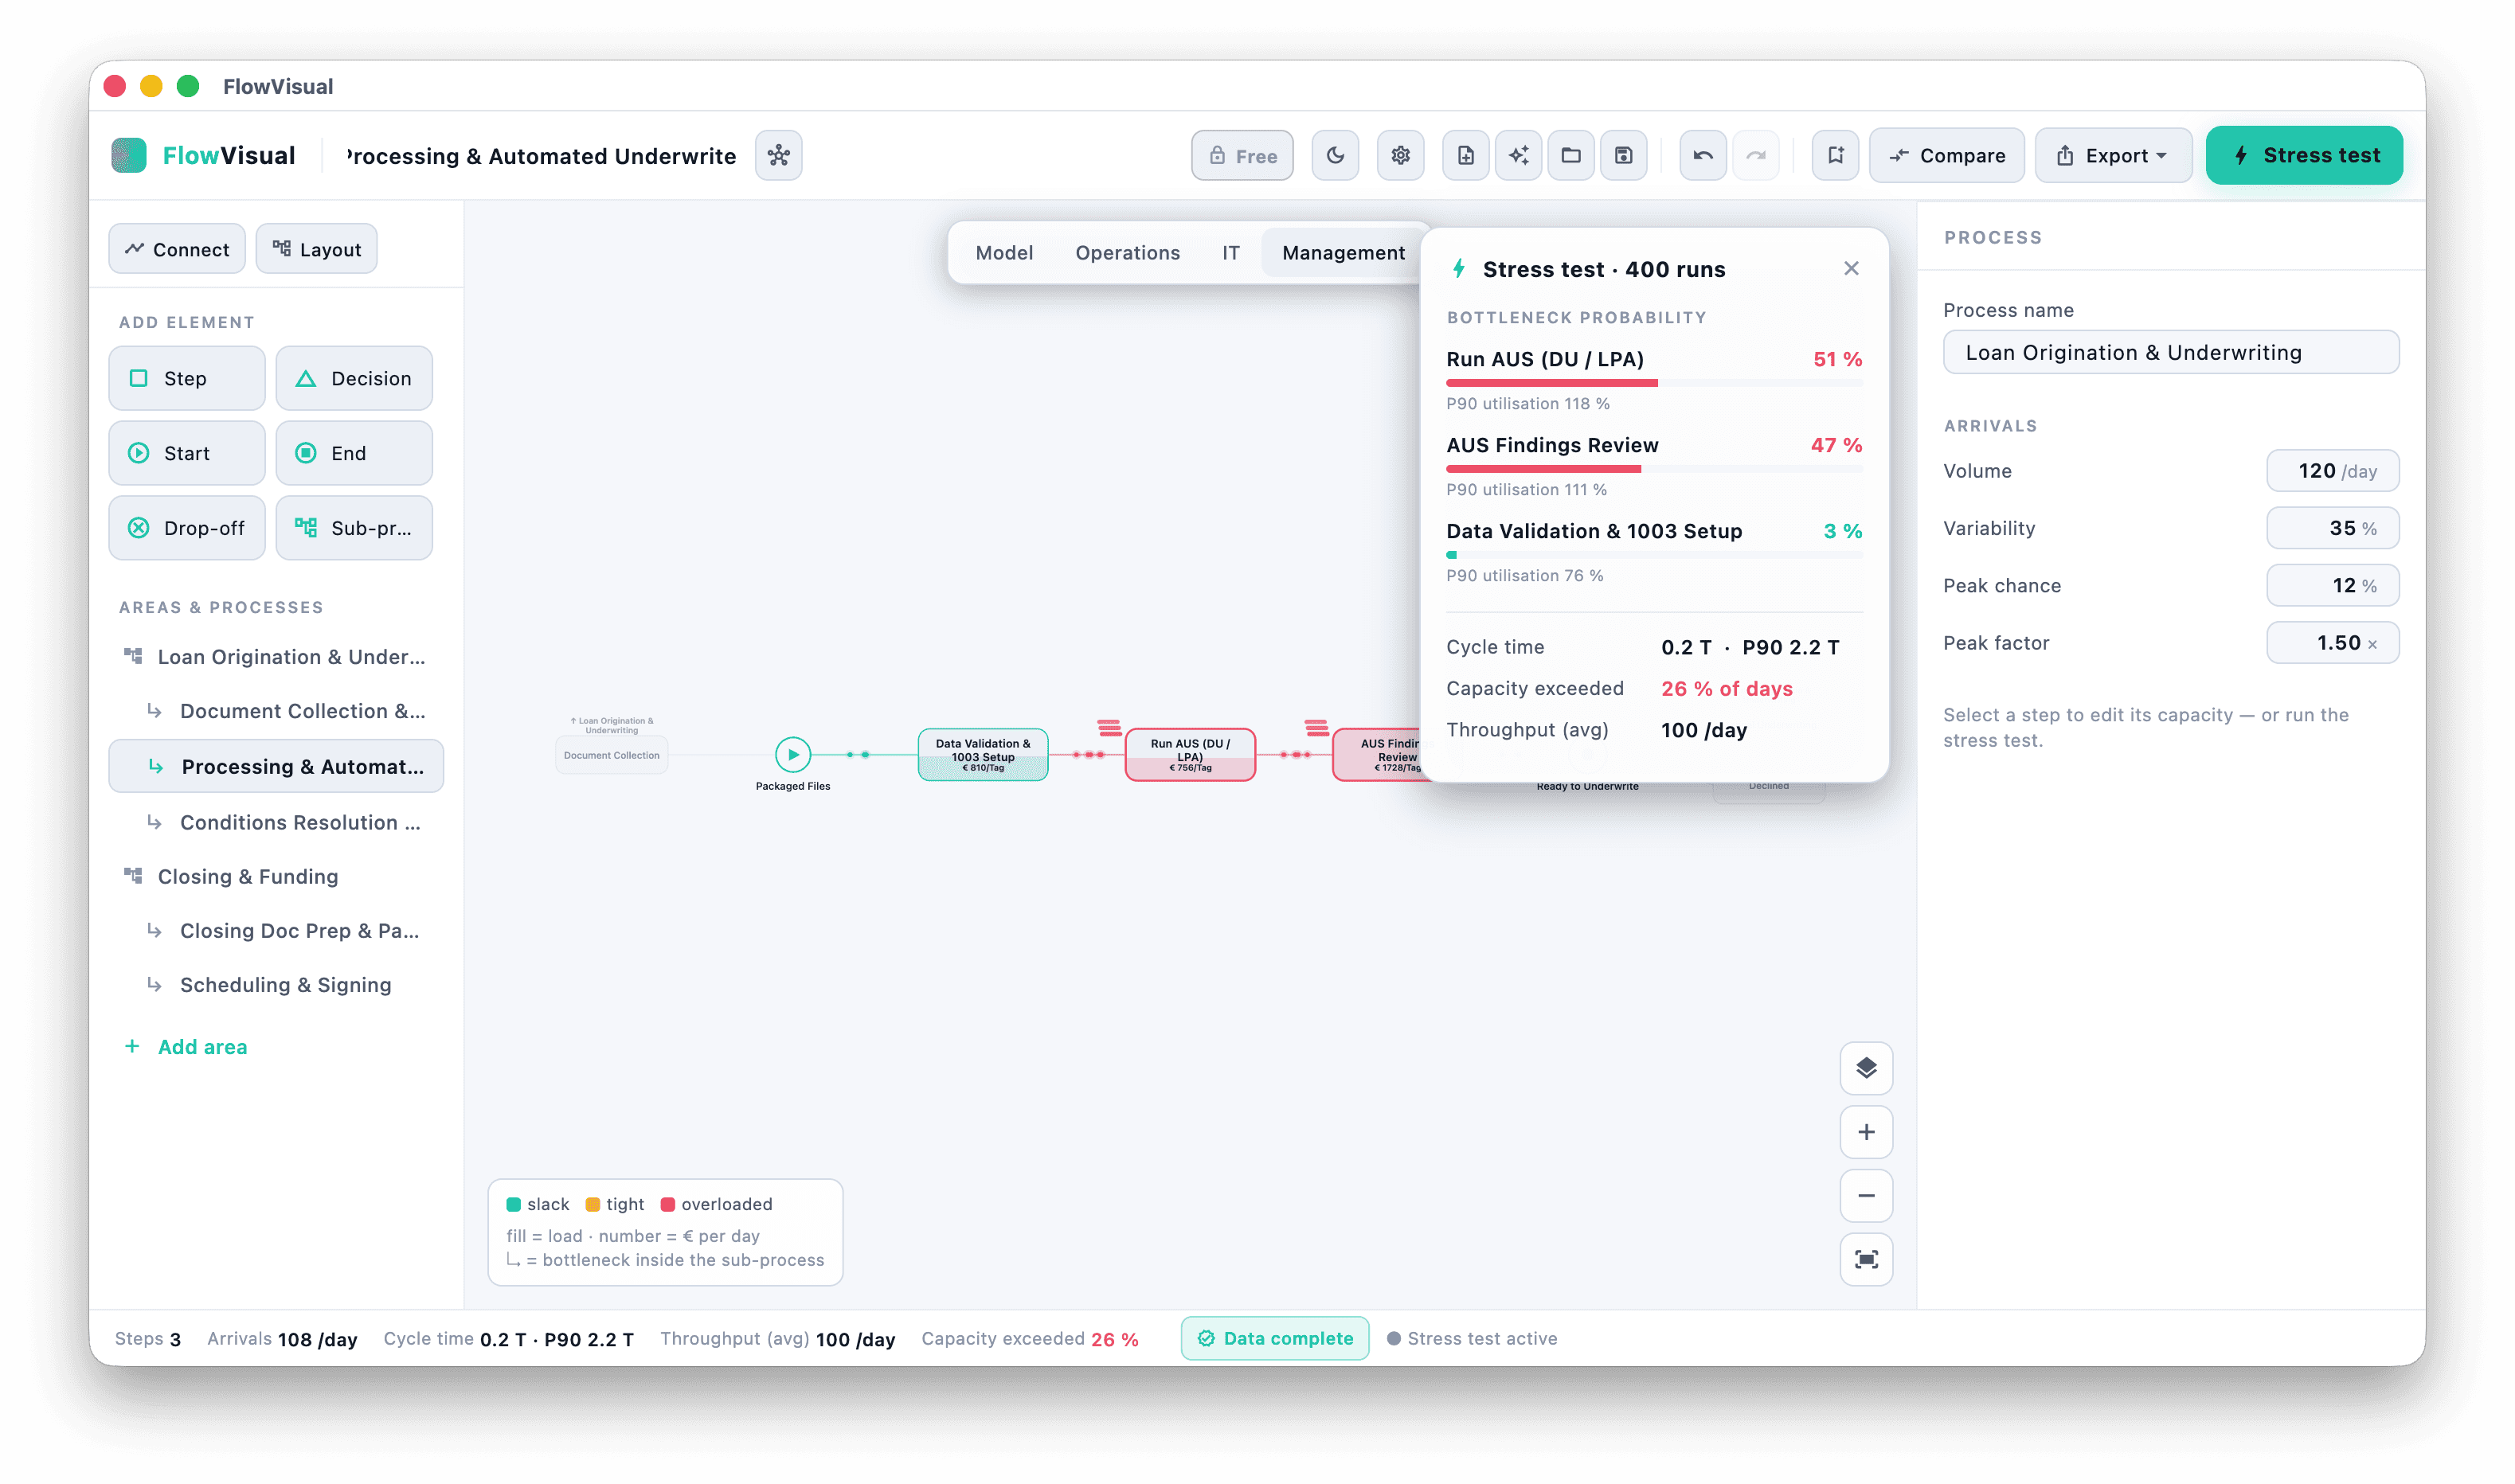
The number that survives the steering committee
- Business case with a P10–P90 band
- Reviewed options, ranked, with a recommendation
- Payback shown only against a real, named investment
Before/after in money and time, with a band instead of false precision. Plus the honest statement of whether the bottleneck is solved, merely moved, or still there, even when that is the less comfortable answer.
Built for numbers that hold up
A tool whose numbers collapse in the first critical meeting has done more damage than good. Hence these four decisions.
Ranges, not false precision
Every figure in money and time comes with a P10–P90 band. Anyone promising a single number to two decimal places is selling you confidence, not an answer.
Runs locally, no account
No cloud, no sign-up, no server. Your process data stays on your drive. That is the reason this tool also clears review in regulated organisations.
It says no, too
If a reviewed option isn't worth it, the document says so. If the bottleneck only moves instead of disappearing, that goes on the cover page.
Mac and Windows
Native desktop app for macOS (Apple Silicon and Intel) and Windows 10/11. Fast, offline, no browser tab stalling in front of a client.
For everyone who has to prove an optimisation rather than claim it
- 01
Process and management consultants
You win the engagement with a picture that runs, and defend it with a number the CFO cannot take apart.
- 02
In-house process and IT leads
You have to justify to a steering committee why this particular step comes first and what the others would not deliver.
- 03
Lean and Six Sigma teams
You know the method. What you lack is a tool that computes variability instead of hiding it inside an average.
Modelling and stress testing stay free
The core of the instrument is not the paywall. You should find the bottleneck before anyone talks about money.
FlowVisual
Everything up to the finished file in your hand, with no limit, no account, no cloud.
- Model, stress-test and compare variants without limits
- All four lenses: Model, Operations, IT, Management
- Save and open as a file, so the model outlives the session
- Proposal and documentation PDFs, real documents carrying a trial mark
FlowVisual Pro
Pro is the shape the result leaves the building in.
- The same PDFs without the watermark
- Your own letterhead: logo, accent colour, sender
- Word version and draw.io/SVG drawing
- A team project folder, over your own drive, no backend
All amounts are gross prices and include VAT where it applies. Business customers with a valid EU VAT ID are billed under the reverse-charge procedure at checkout, and the amount drops accordingly. Outside the EU, Lemon Squeezy determines the applicable tax at checkout as the seller of record.
Billed in euros by Lemon Squeezy, our seller of record. In the Mac App Store the purchase runs through your Apple account instead, at the price shown there, but only Solo is available that way. Consulting and Enterprise are sold through Lemon Squeezy only.
The instrument to a method, not the other way round
FlowVisual did not start as software. It started as the answer to a consulting problem: process optimisation doesn't fail on the idea, it fails the moment someone asks “and how do we know that?”. The method behind it is called Flowrefy. We use it in our own engagements, and every analysis in our archive was produced with this exact instrument.
Flowrefy is the practice, FlowVisual the instrument. Both belong to Balane GmbH.
Get FlowVisual 1.2.1
Native app for macOS and Windows. Modelling and stress testing are free forever, and you don't need an account to start.
macOS 13 or newer (Apple Silicon and Intel) · Windows 10/11
Frequently asked
Do I need an account or a cloud?
No. FlowVisual runs entirely on your machine. There is no sign-up and no server, and your process files live on your drive. To collaborate, put the project folder on a shared drive or in SharePoint.
Is this BPMN?
No, deliberately not. BPMN is a documentation notation; FlowVisual is a measuring instrument. You assemble the process from six building blocks in minutes instead of learning a notation. If you need BPMN for documentation, FlowVisual does not replace it, it answers a different question.
Where do the numbers come from?
From you: volumes, durations as ranges, capacities, cost per role. A discrete-event simulator with Monte Carlo repetition turns that into probabilities instead of a single wishful number. Every output carries its band, and the handbook prints the seed and the run count so a result stays reproducible.
What does FlowVisual cost?
Modelling, stress testing, saving and the trial-marked PDFs are free forever, with no account and no limit. You need Pro for the PDFs without the watermark, your own letterhead, the Word version, the draw.io drawing and the team project folder. The current amounts are in the pricing section.
How accurate are the results?
As accurate as your inputs, and the tool says so. That's why there is no single number but a P10–P90 band, and why the status bar tells you whether the data is good enough for a defensible statement. A model built on estimates will reliably show you where the bottleneck is; for the euro figure in a proposal, volumes and capacities should be measured.
Can I hand the result to a client?
Yes, that's what it is built for. The proposal PDF and the documentation handbook come out of the same model, free with a trial mark, and with Pro without the watermark and carrying your logo, your colours and your sender details.
Rather do it together? We'll model your most expensive process with you.
In 20 minutes we capture your most important process and show you the bottleneck in euros, live in FlowVisual.
No sales pitch. No slides. Straight talk.